

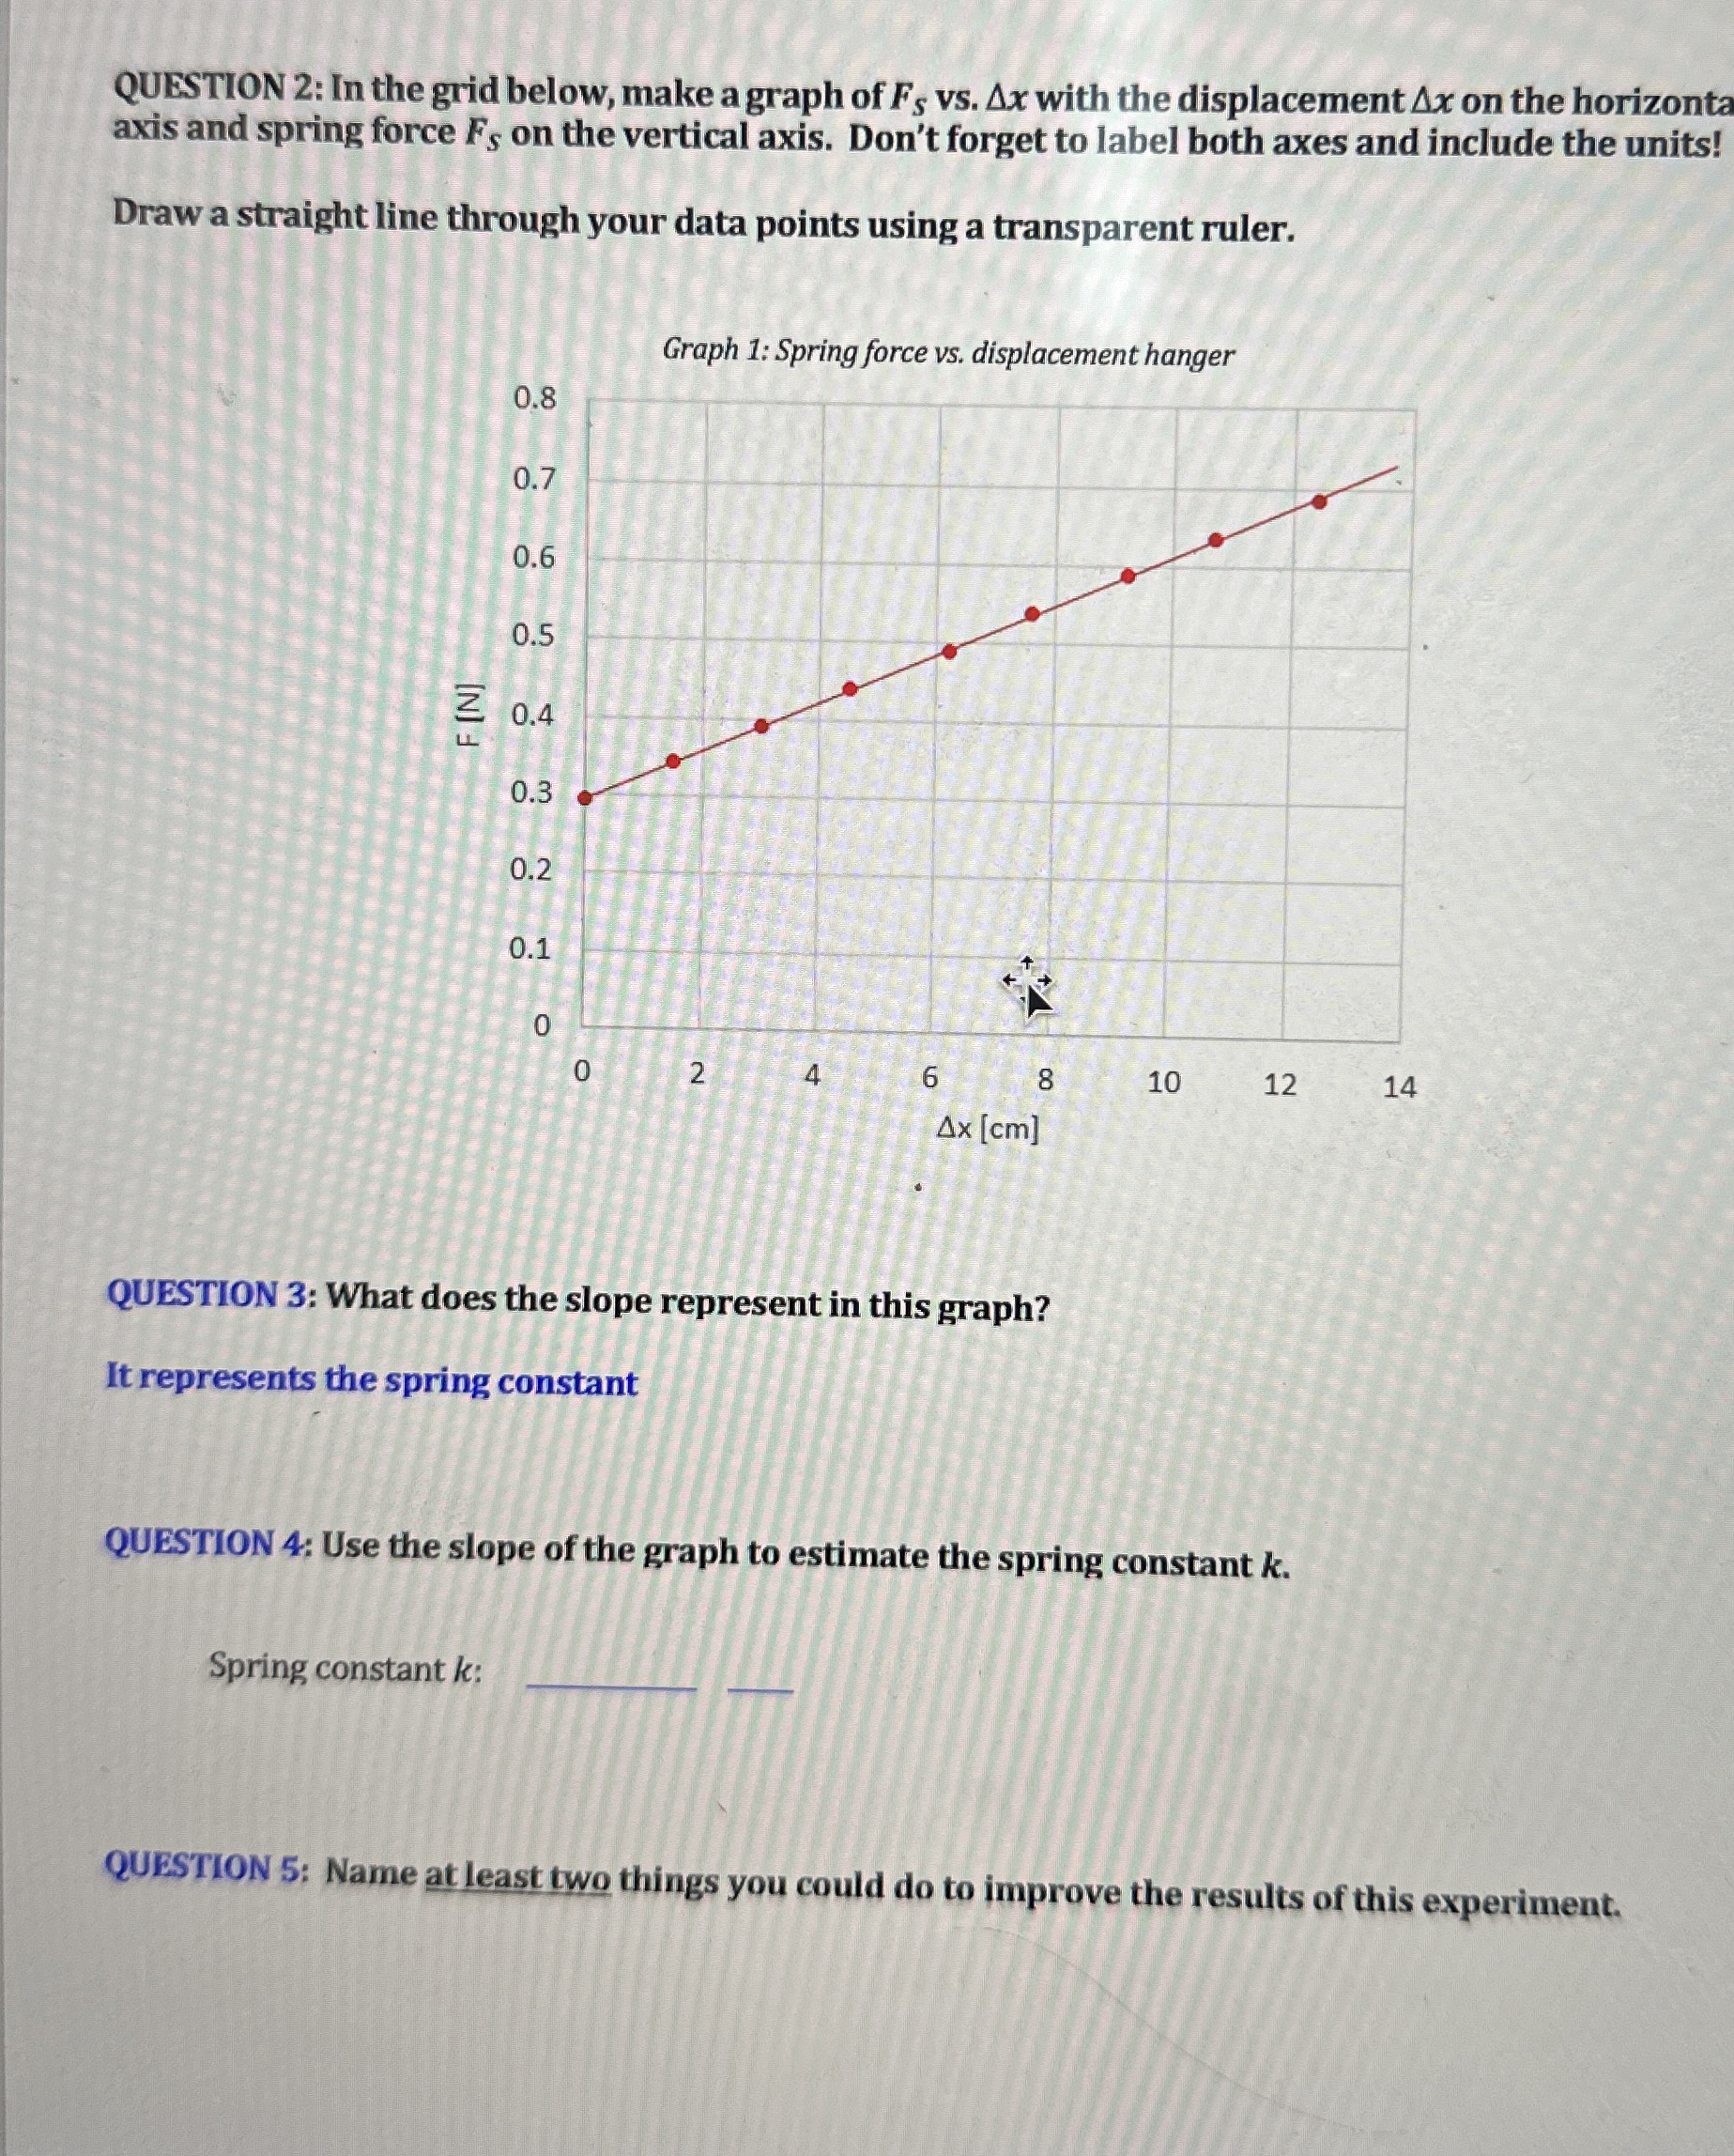
Question: QUESTION 2 : In the grid below, make a graph of F S vs . x with the displacement x on the horizonta axis and
QUESTION : In the grid below, make a graph of vs with the displacement on the horizonta axis and spring force on the vertical axis. Don't forget to label both axes and include the units!
Draw a straight line through your data points using a transparent ruler.
Graph : Spring force vs displacement hanger
QUESTION : What does the slope represent in this graph?
It represents the spring constant
QUESTION : Use the slope of the graph to estimate the spring constant
Spring constant :
QUESTION : Name at least two things you could do to improve the results of this experiment.
Step by Step Solution
There are 3 Steps involved in it
1 Expert Approved Answer
Step: 1 Unlock

Question Has Been Solved by an Expert!
Get step-by-step solutions from verified subject matter experts
Step: 2 Unlock
Step: 3 Unlock