Question: Question 2 Is the average time to complete an obstacle course shorter when a patch is placed over the right eye than when a patch
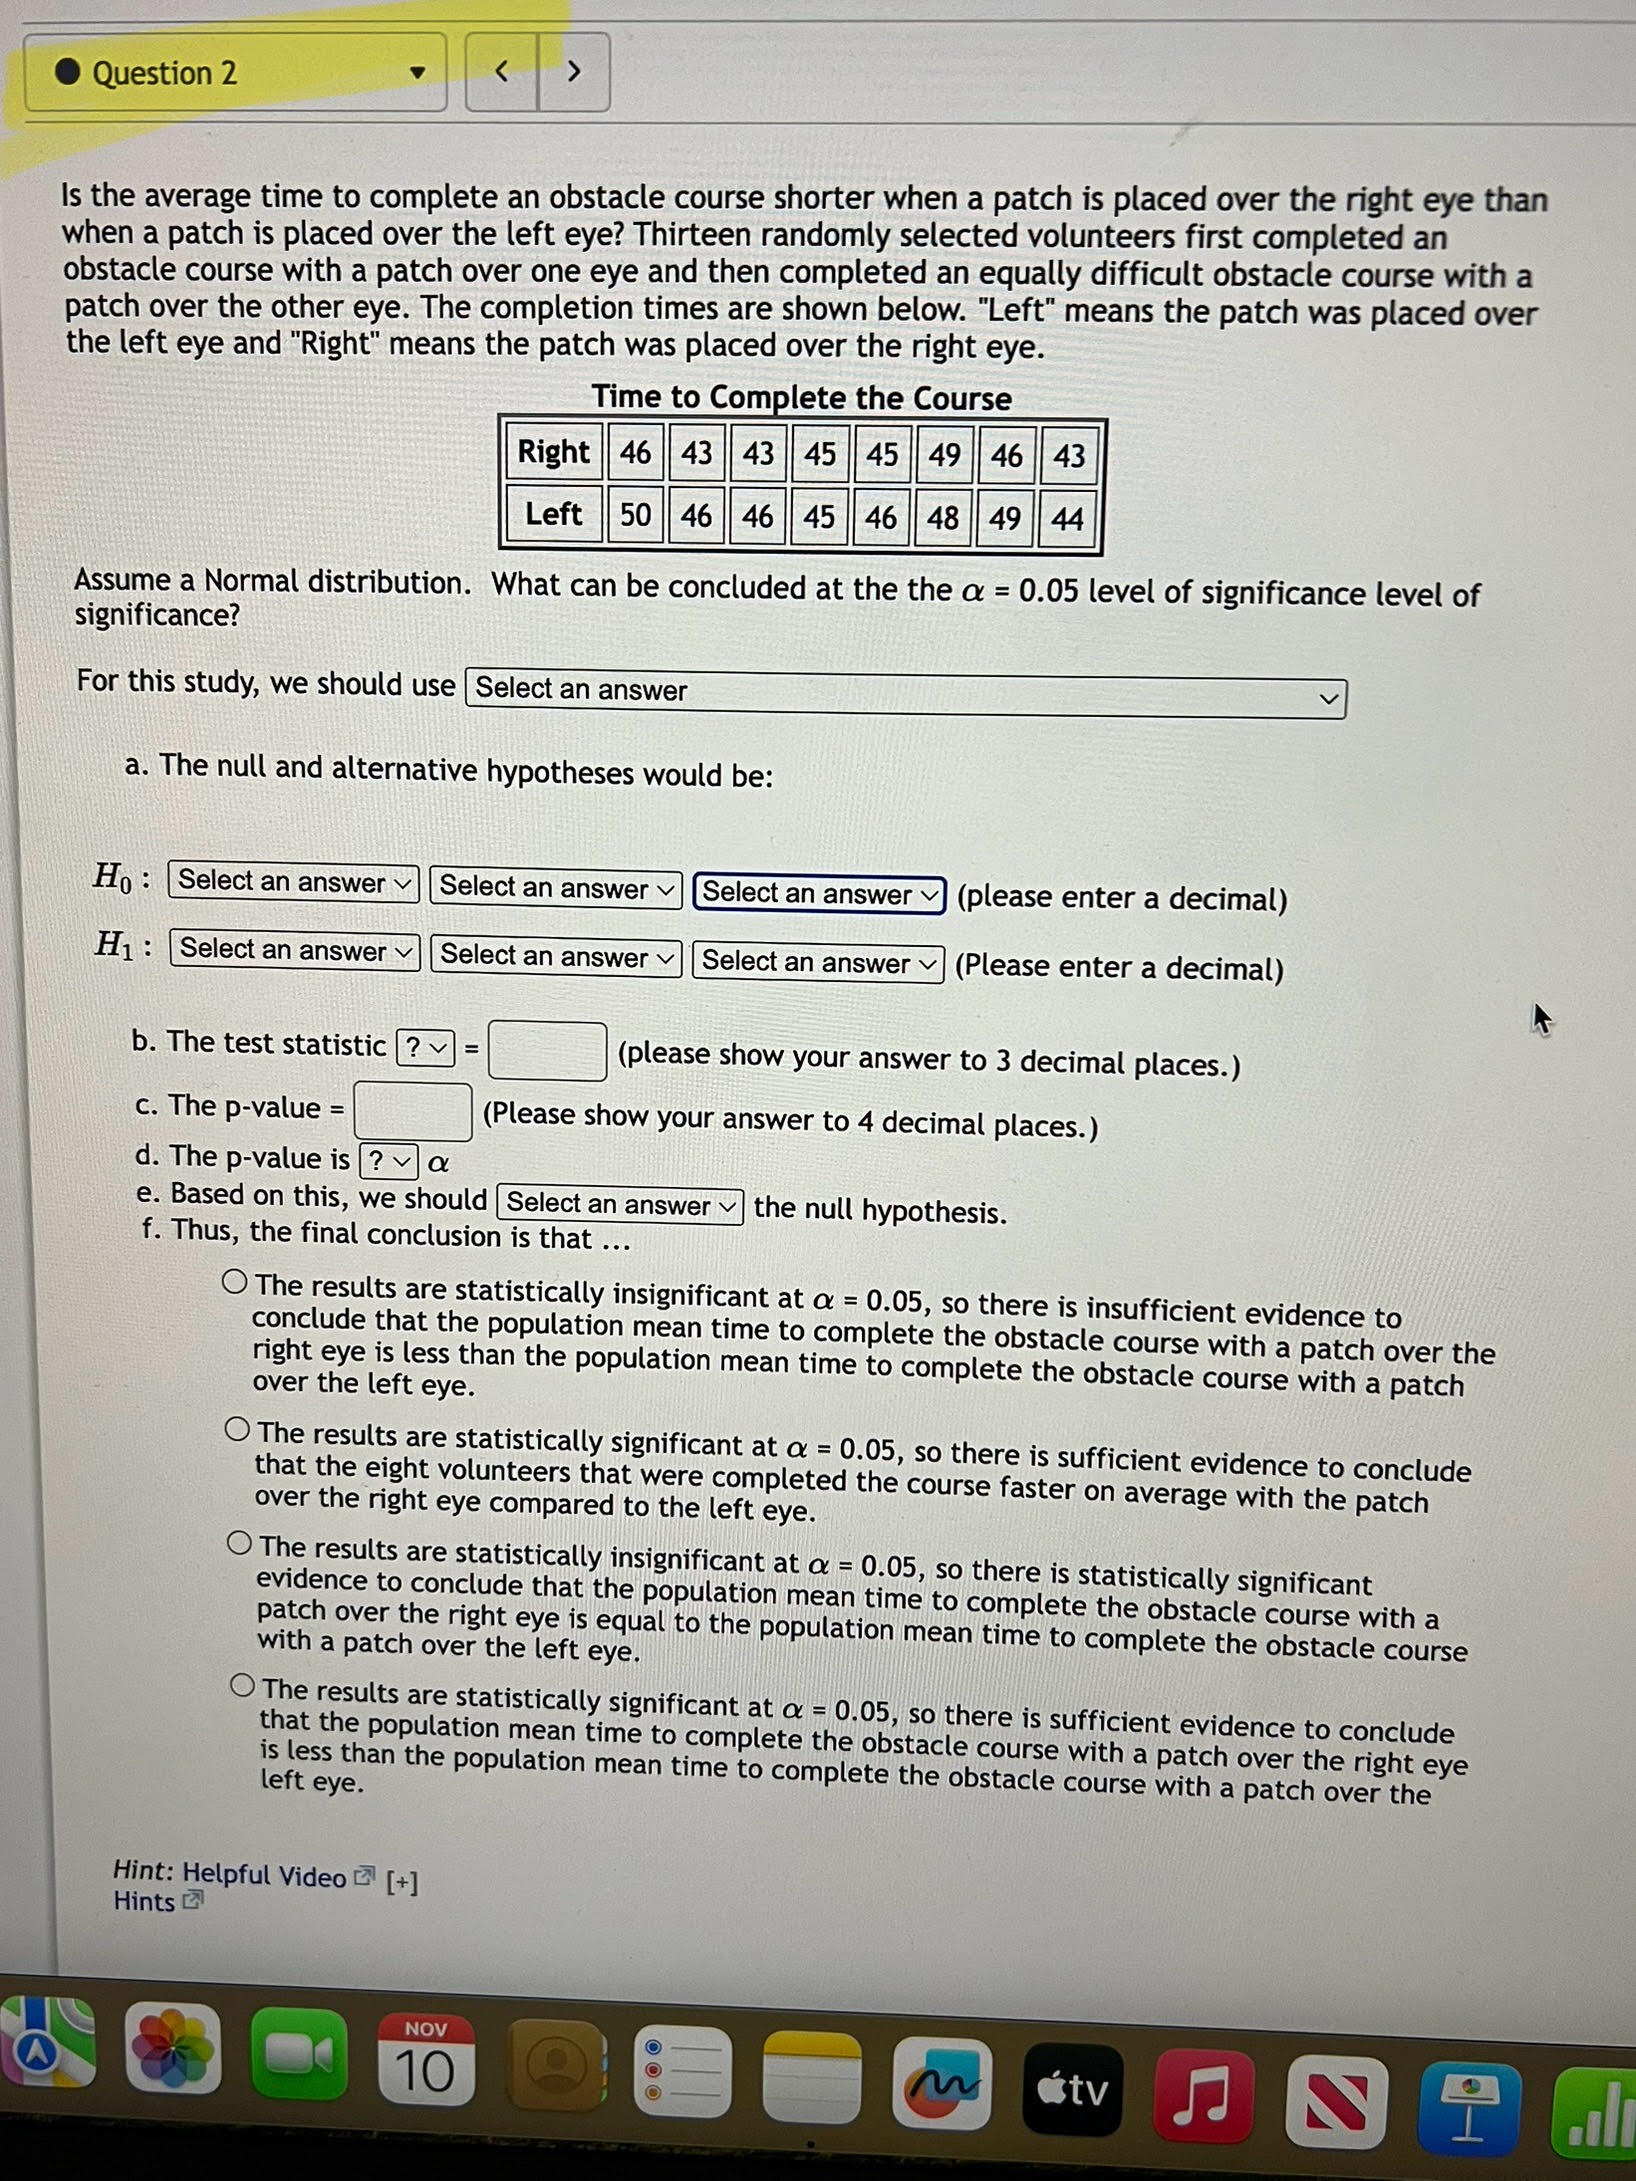
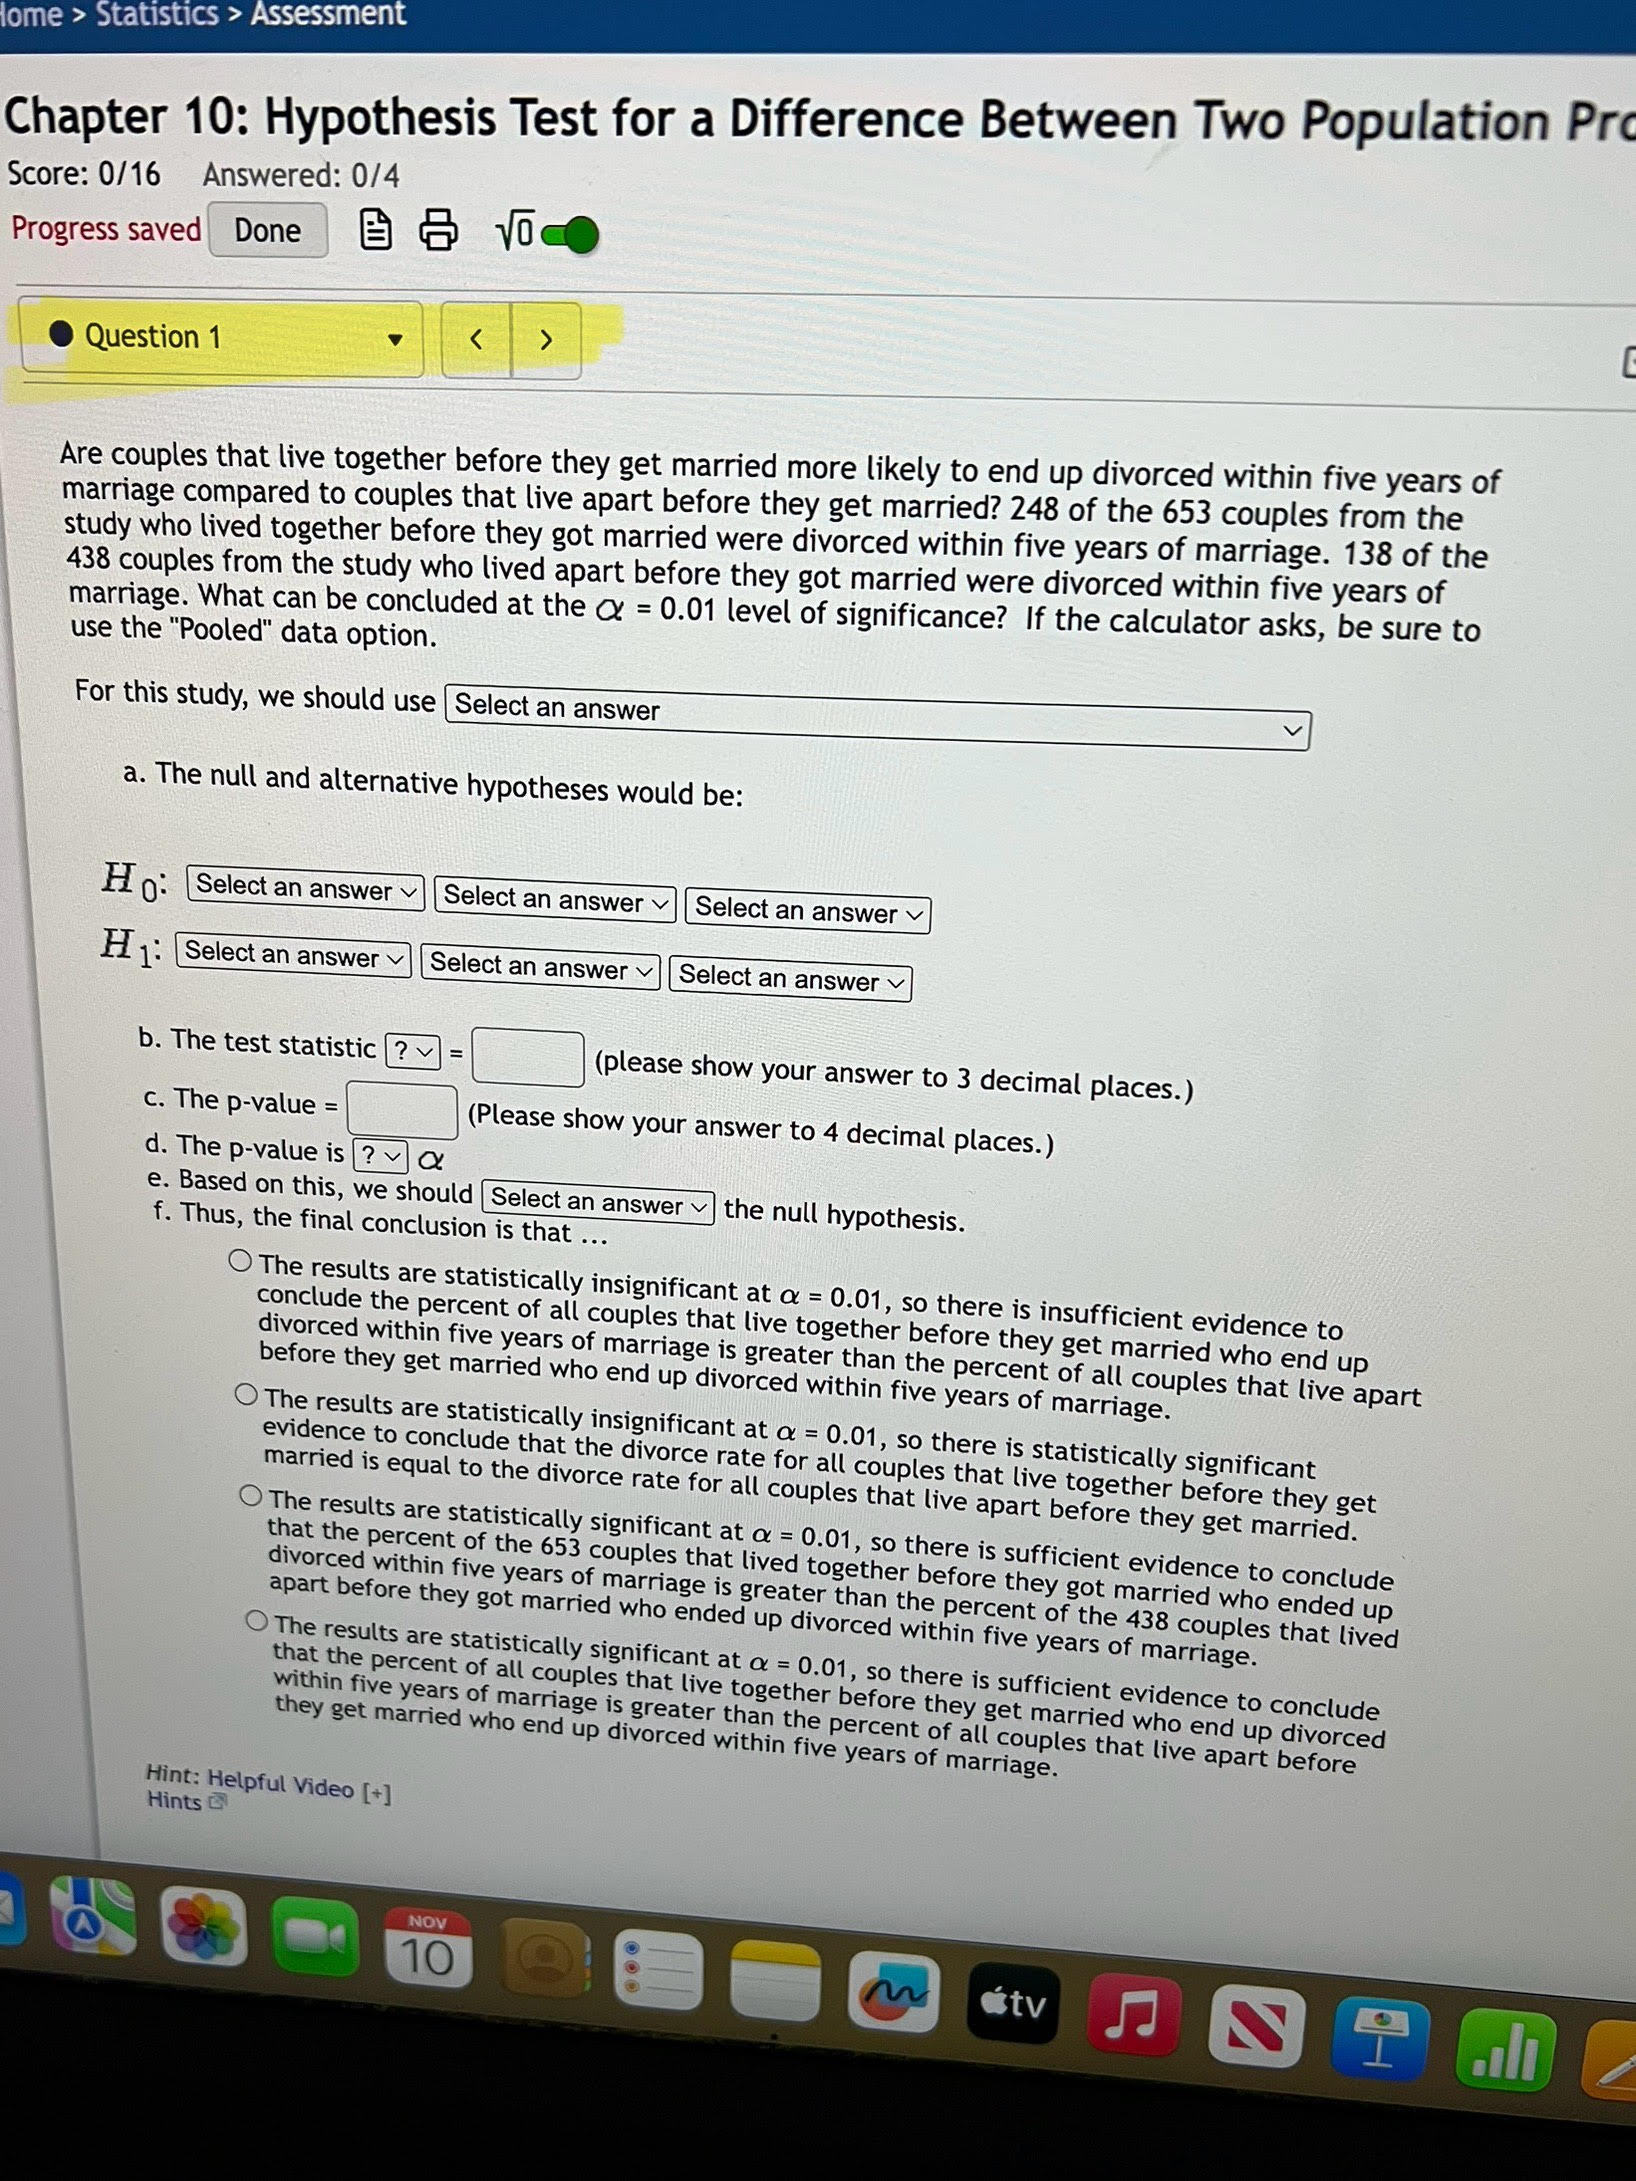
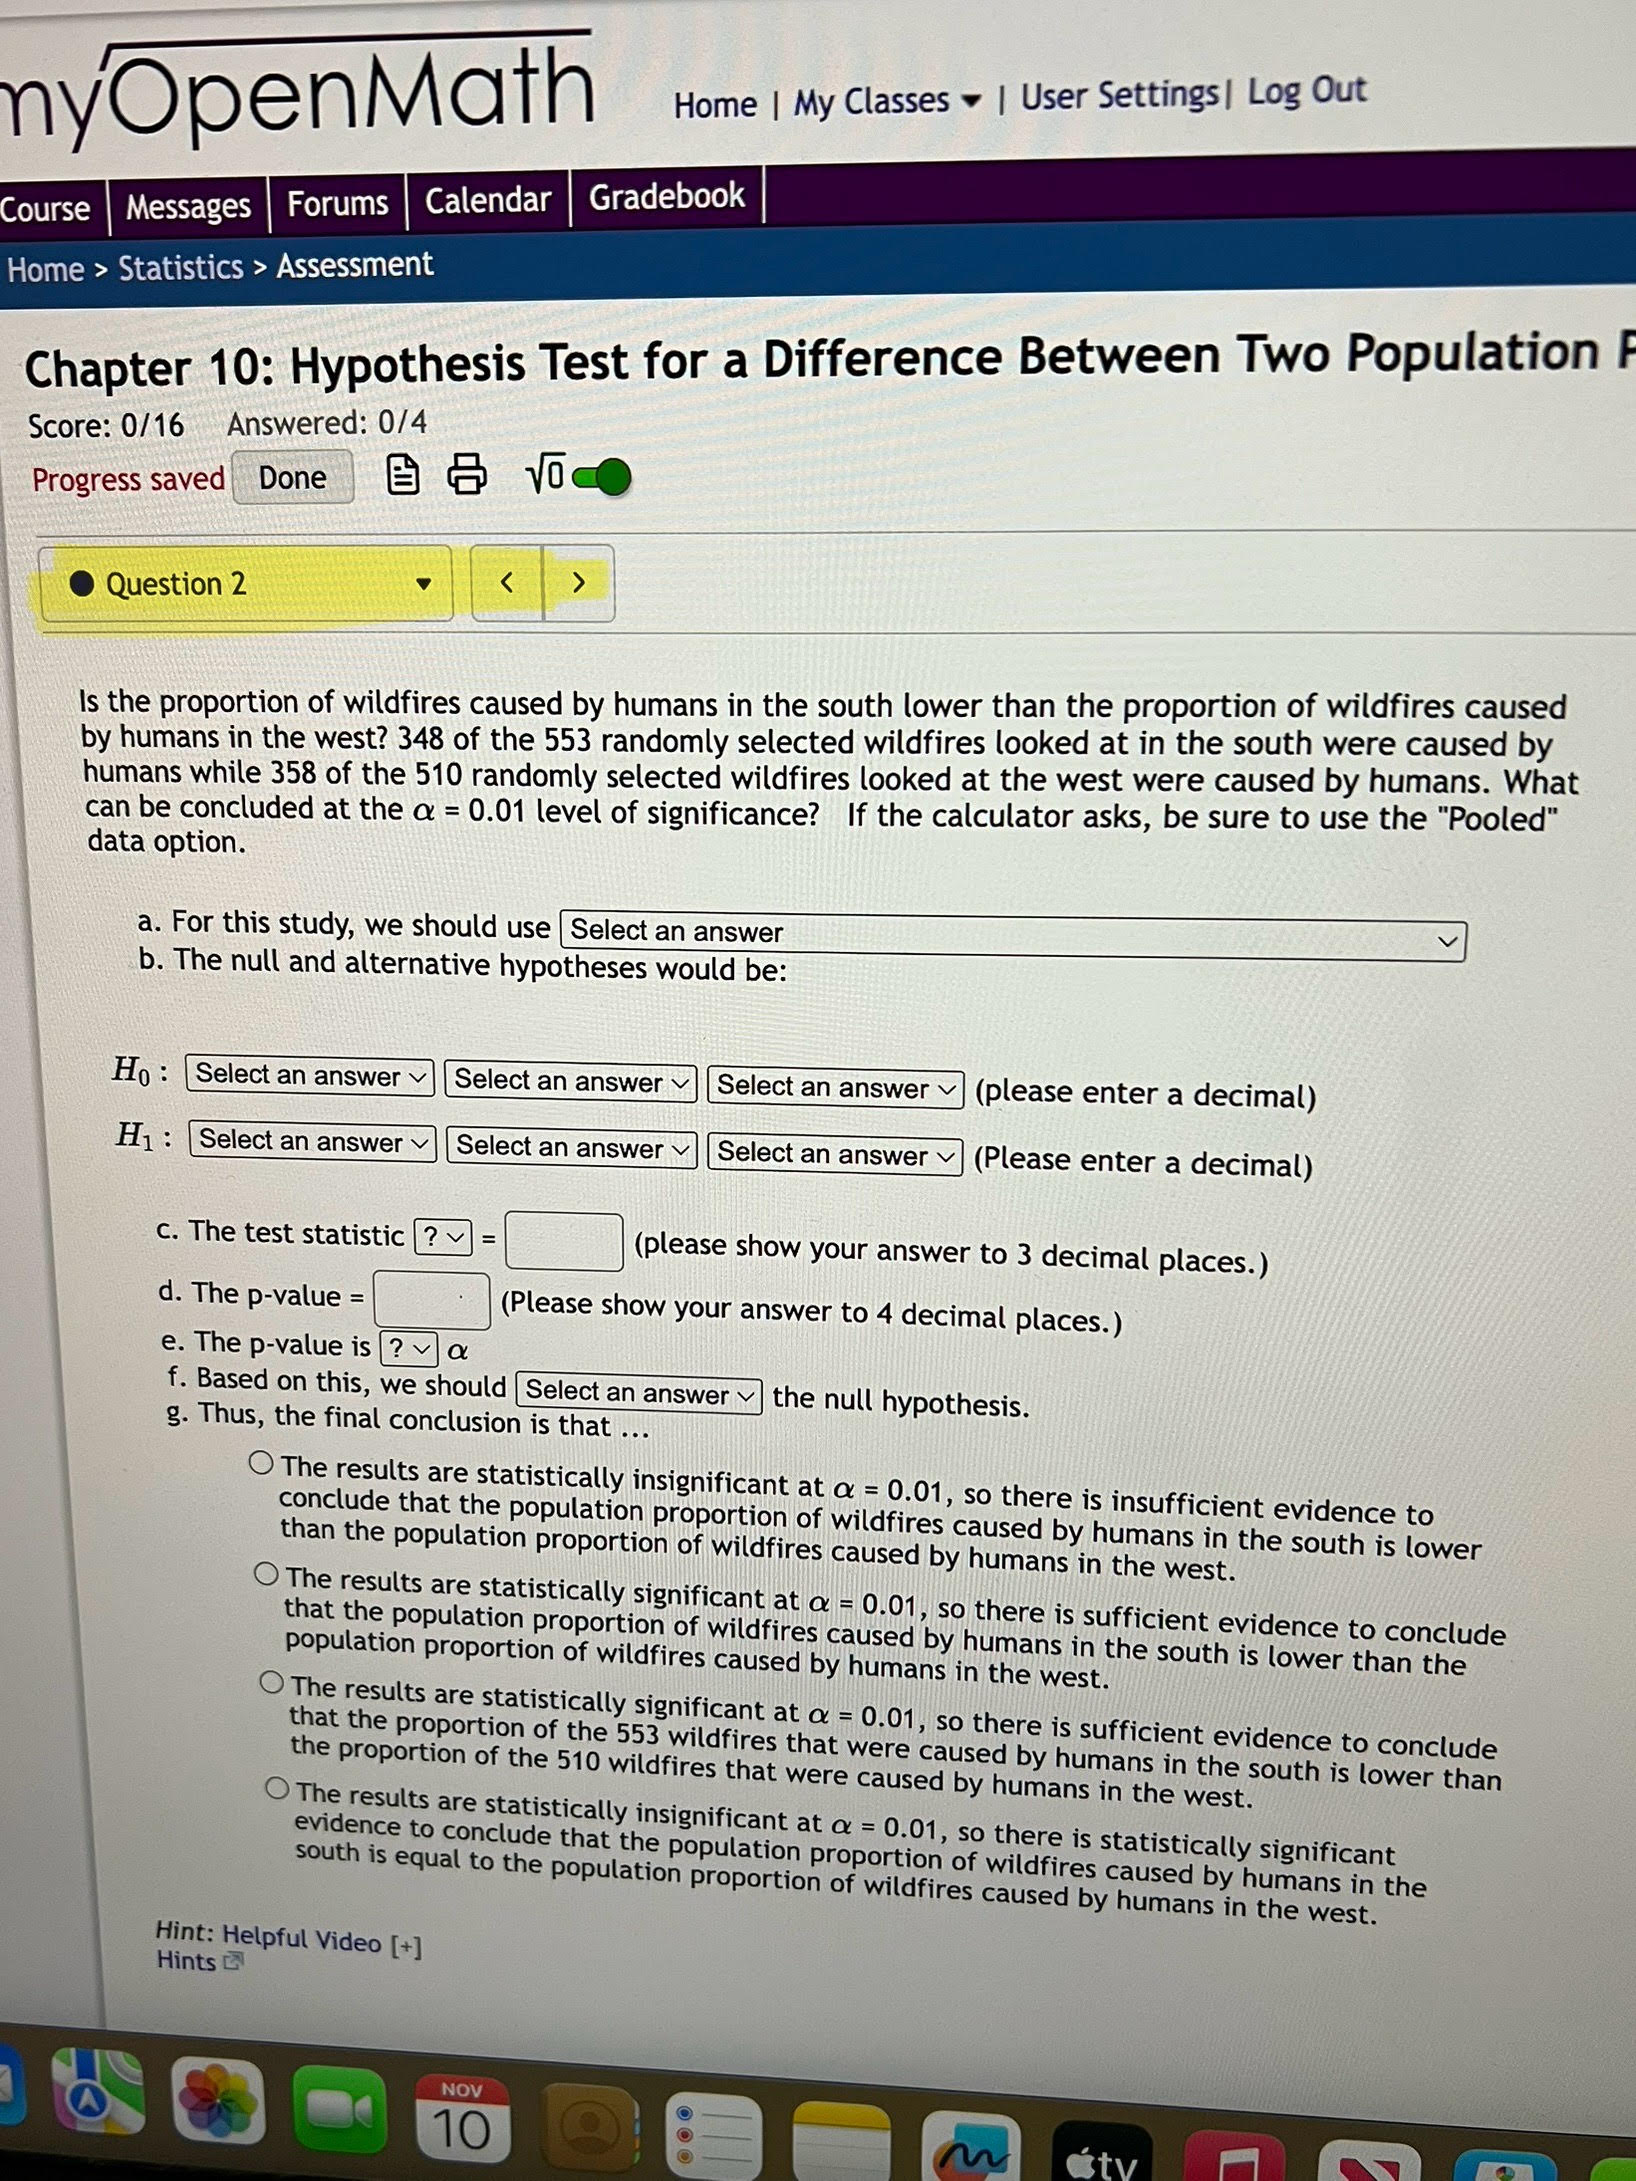
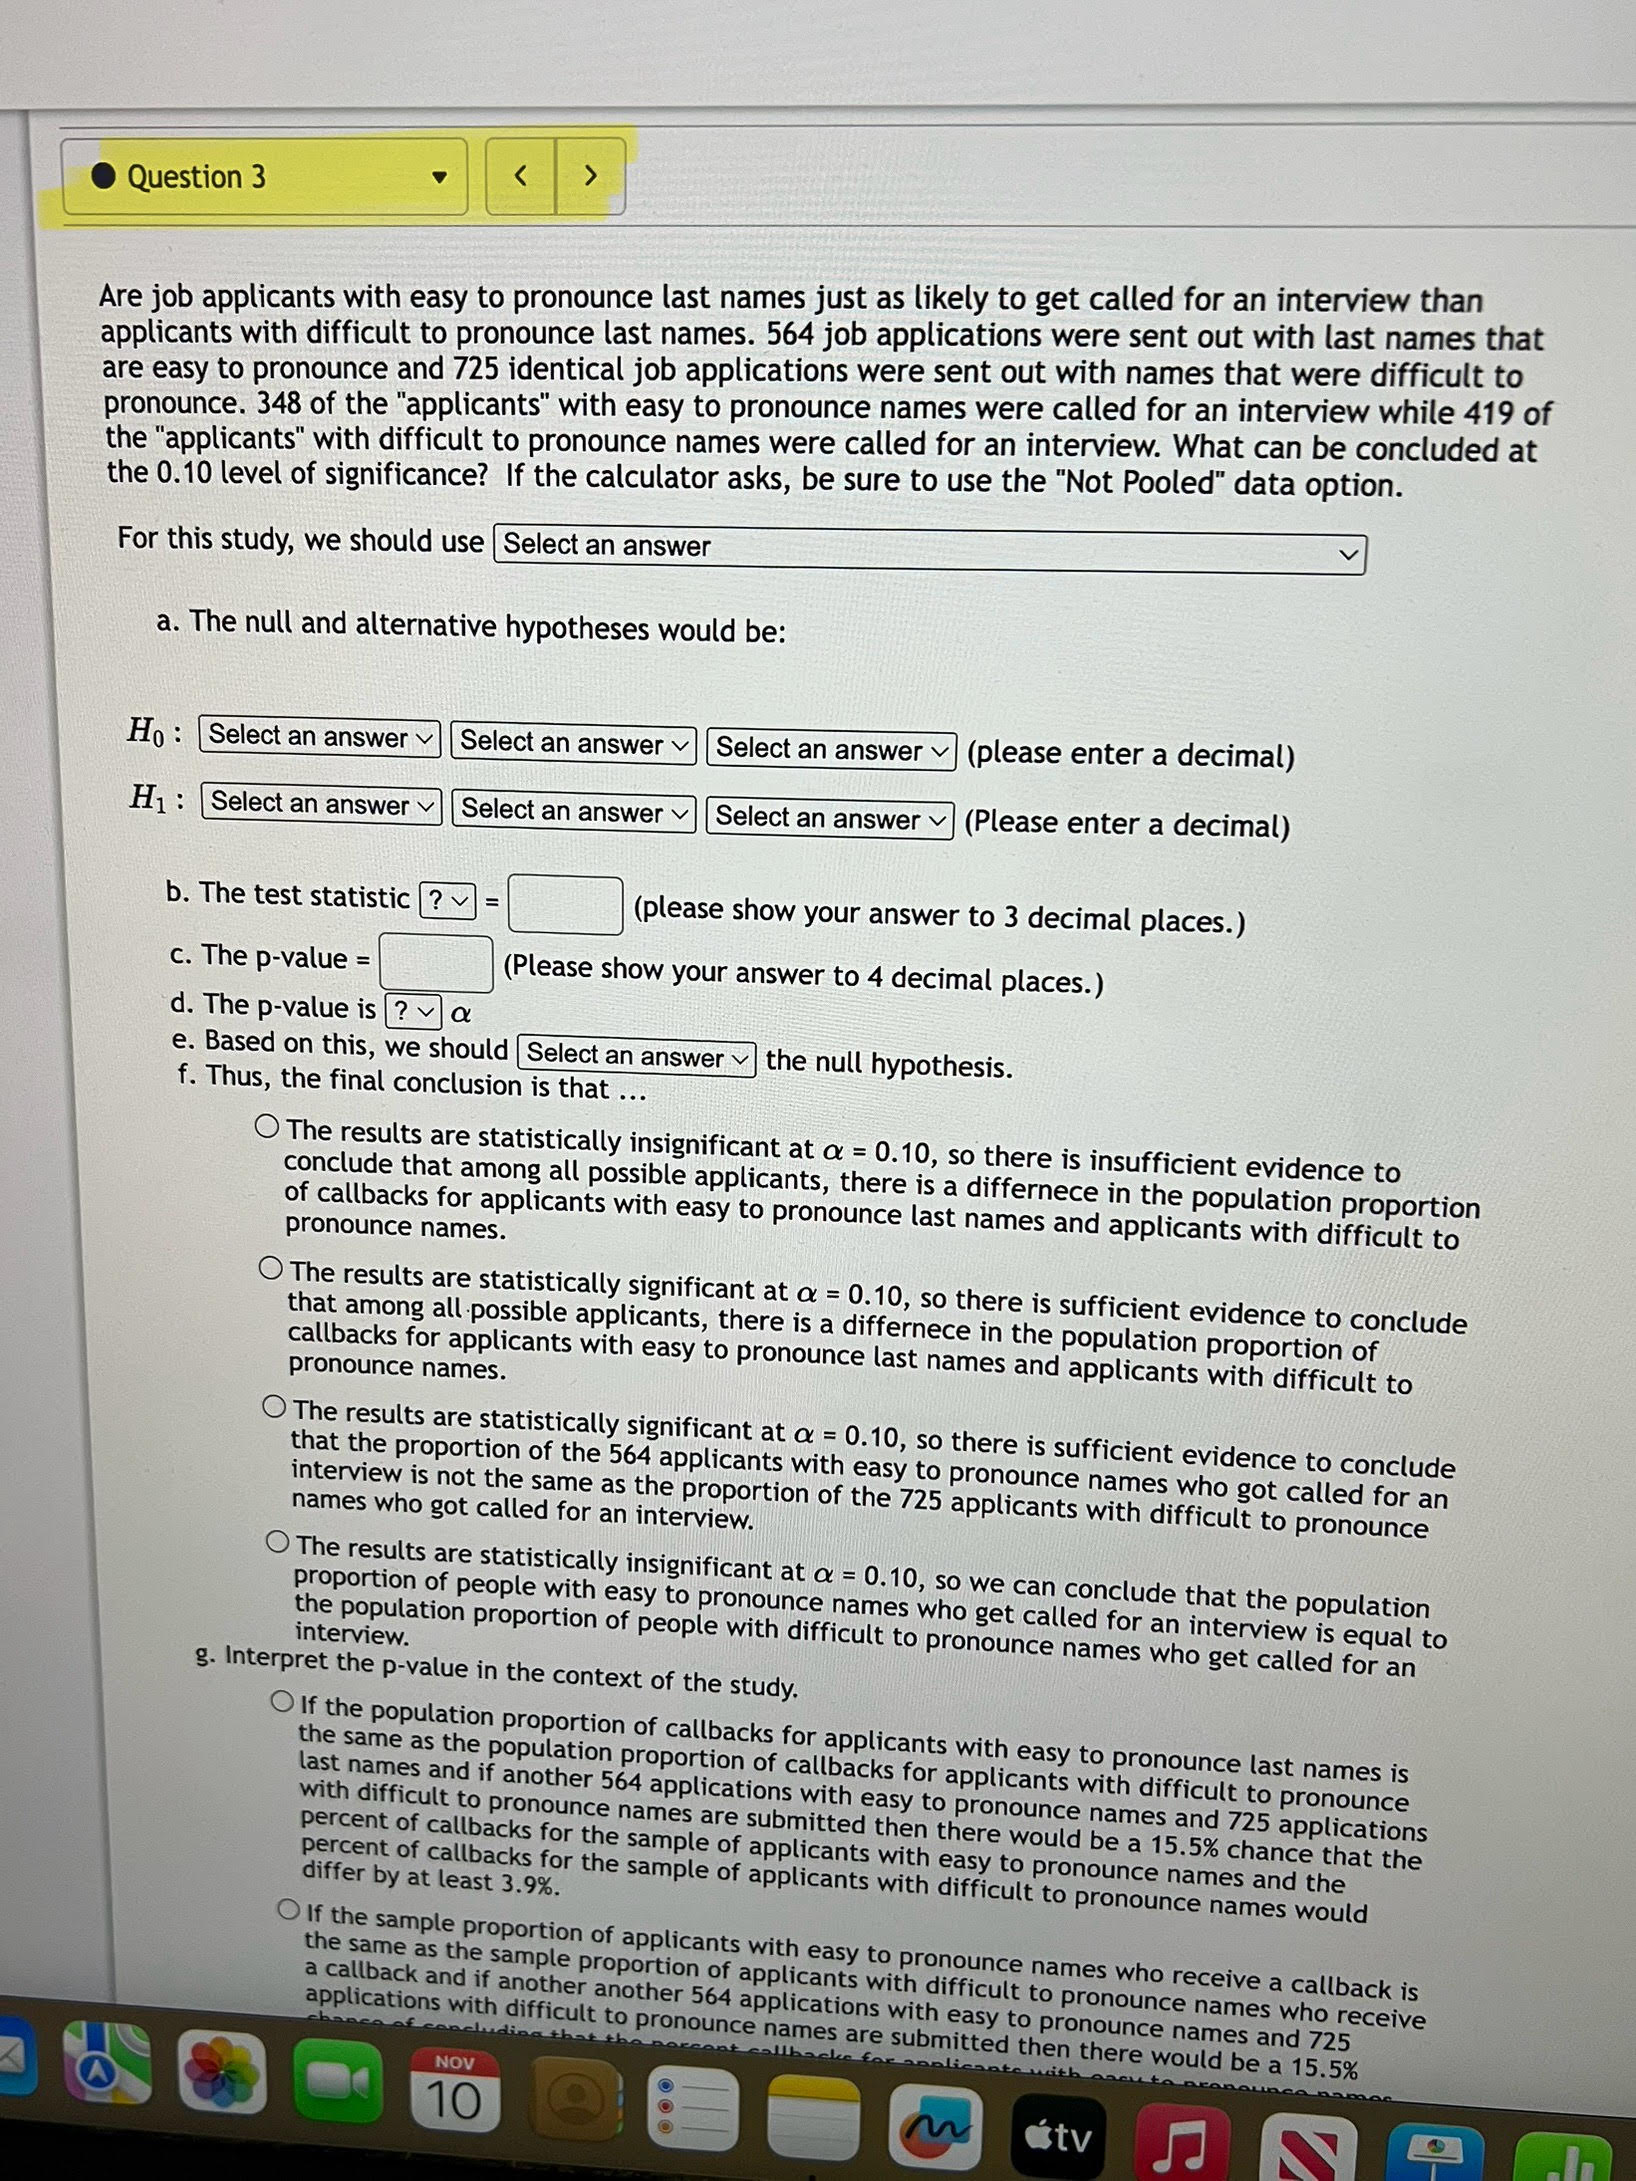
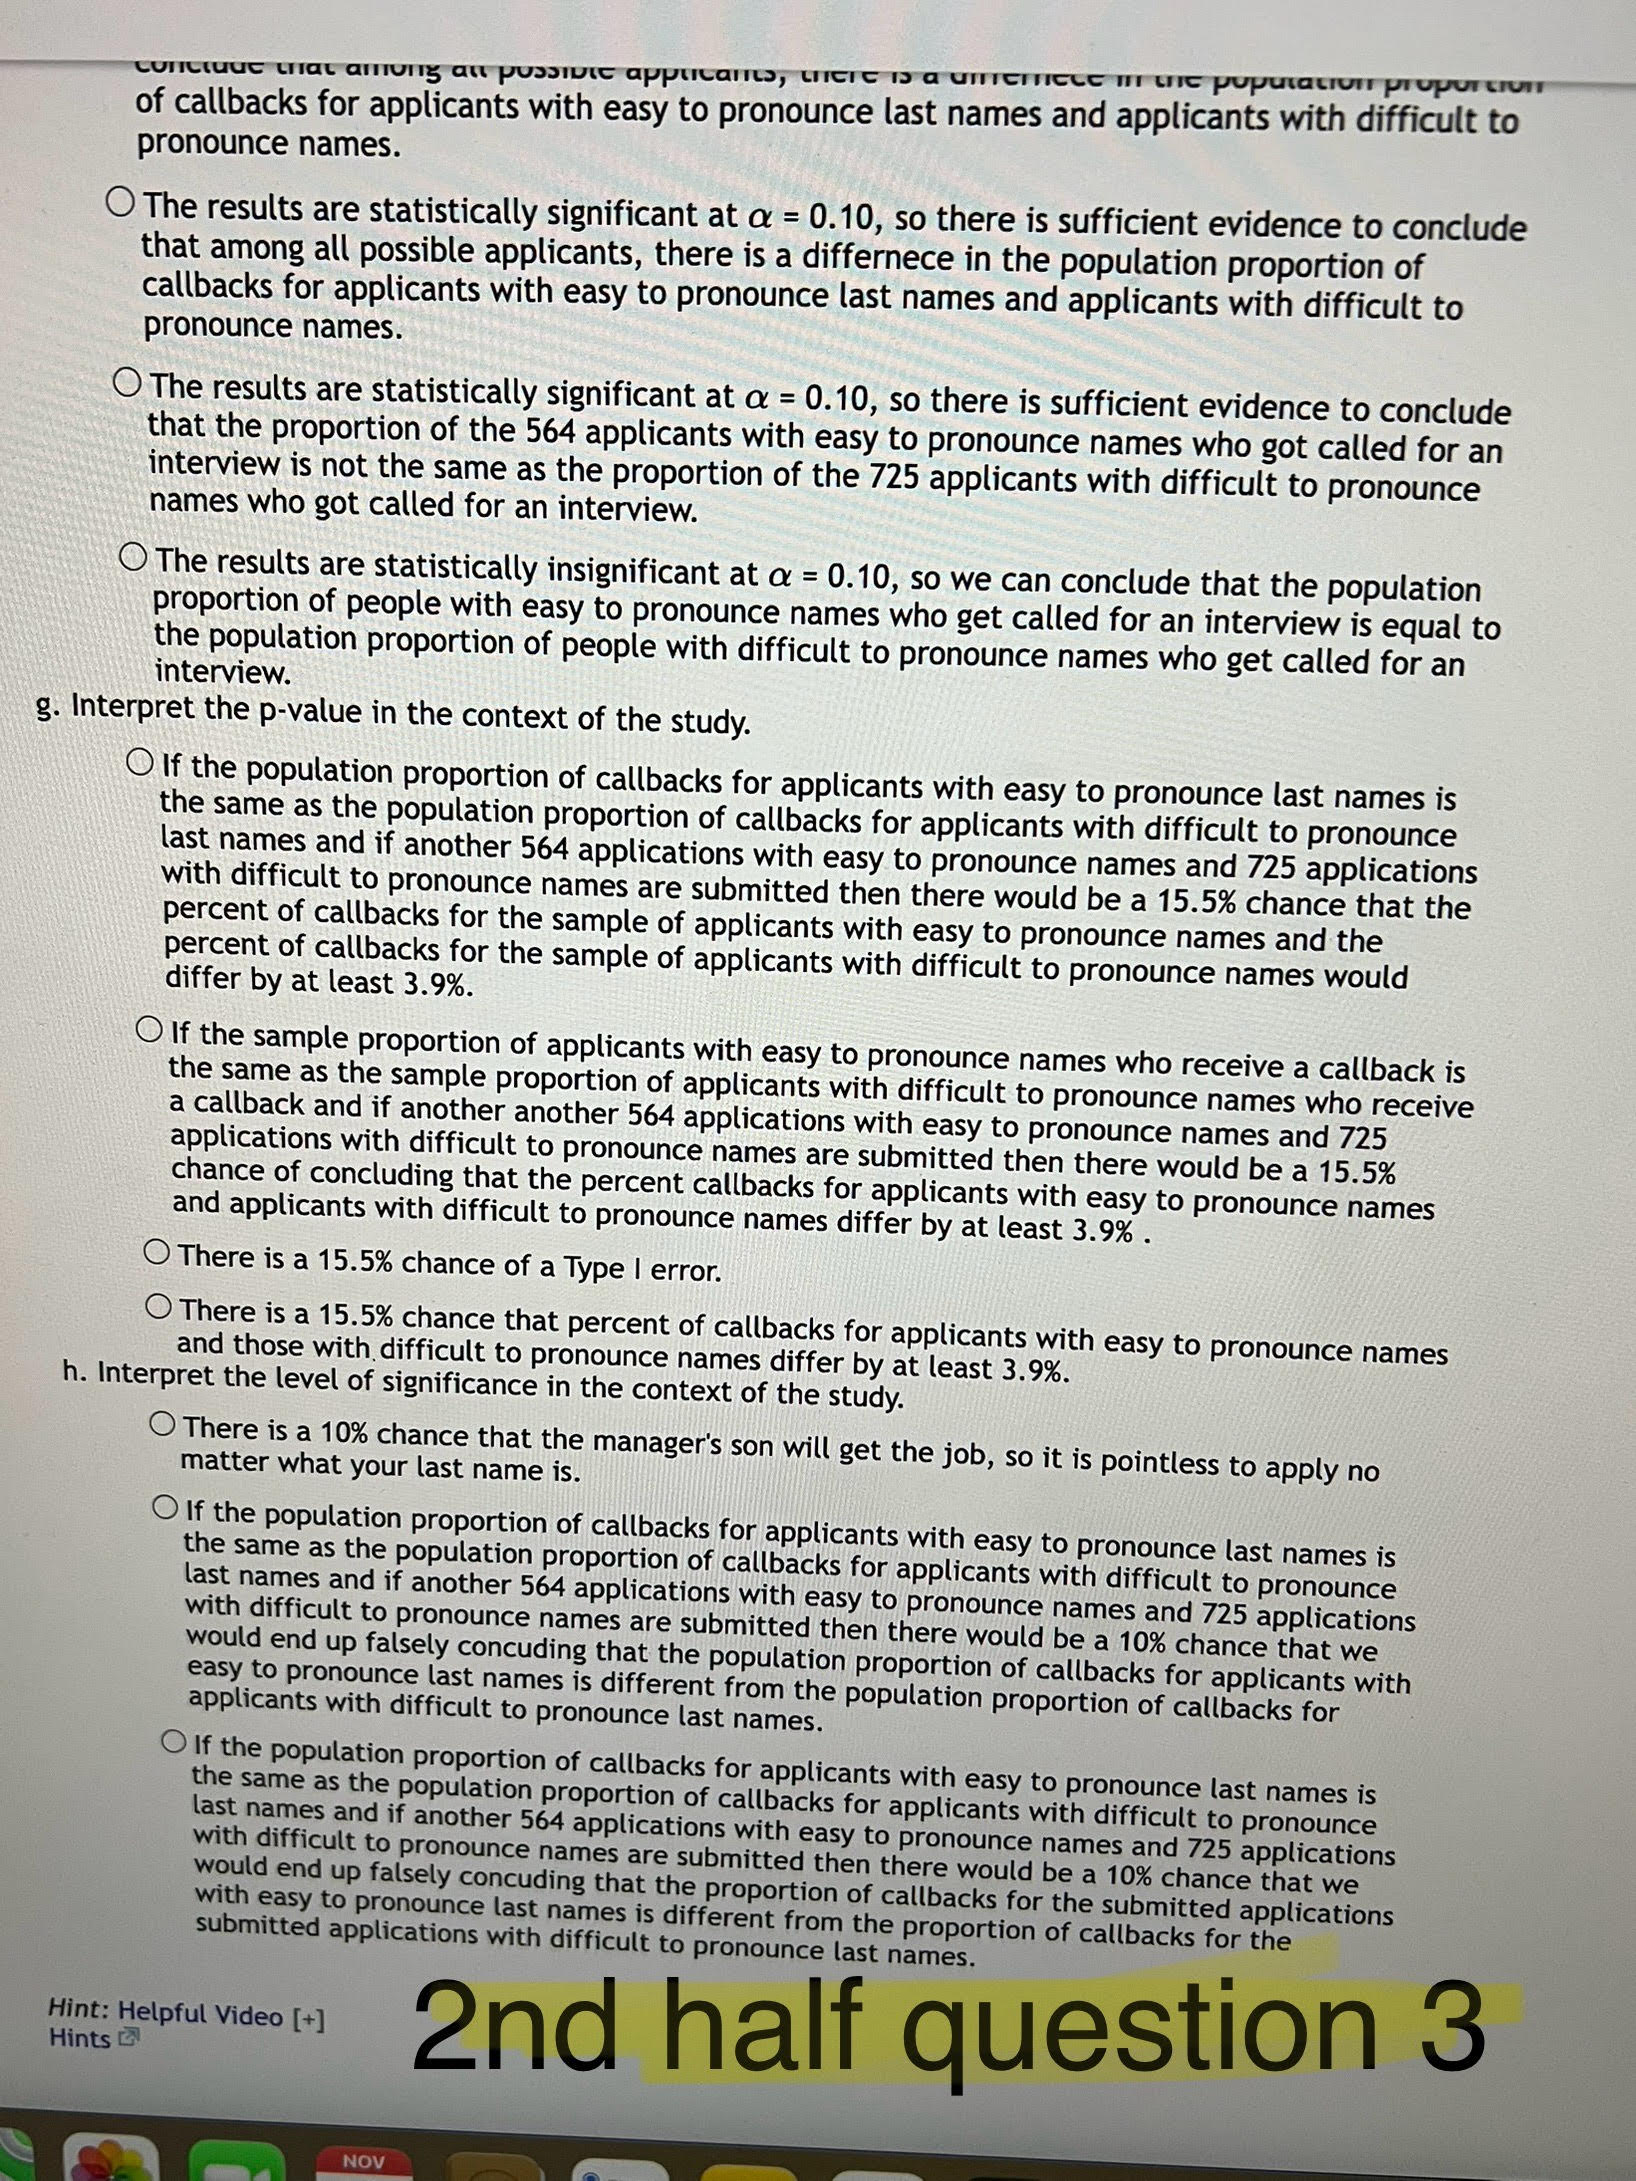
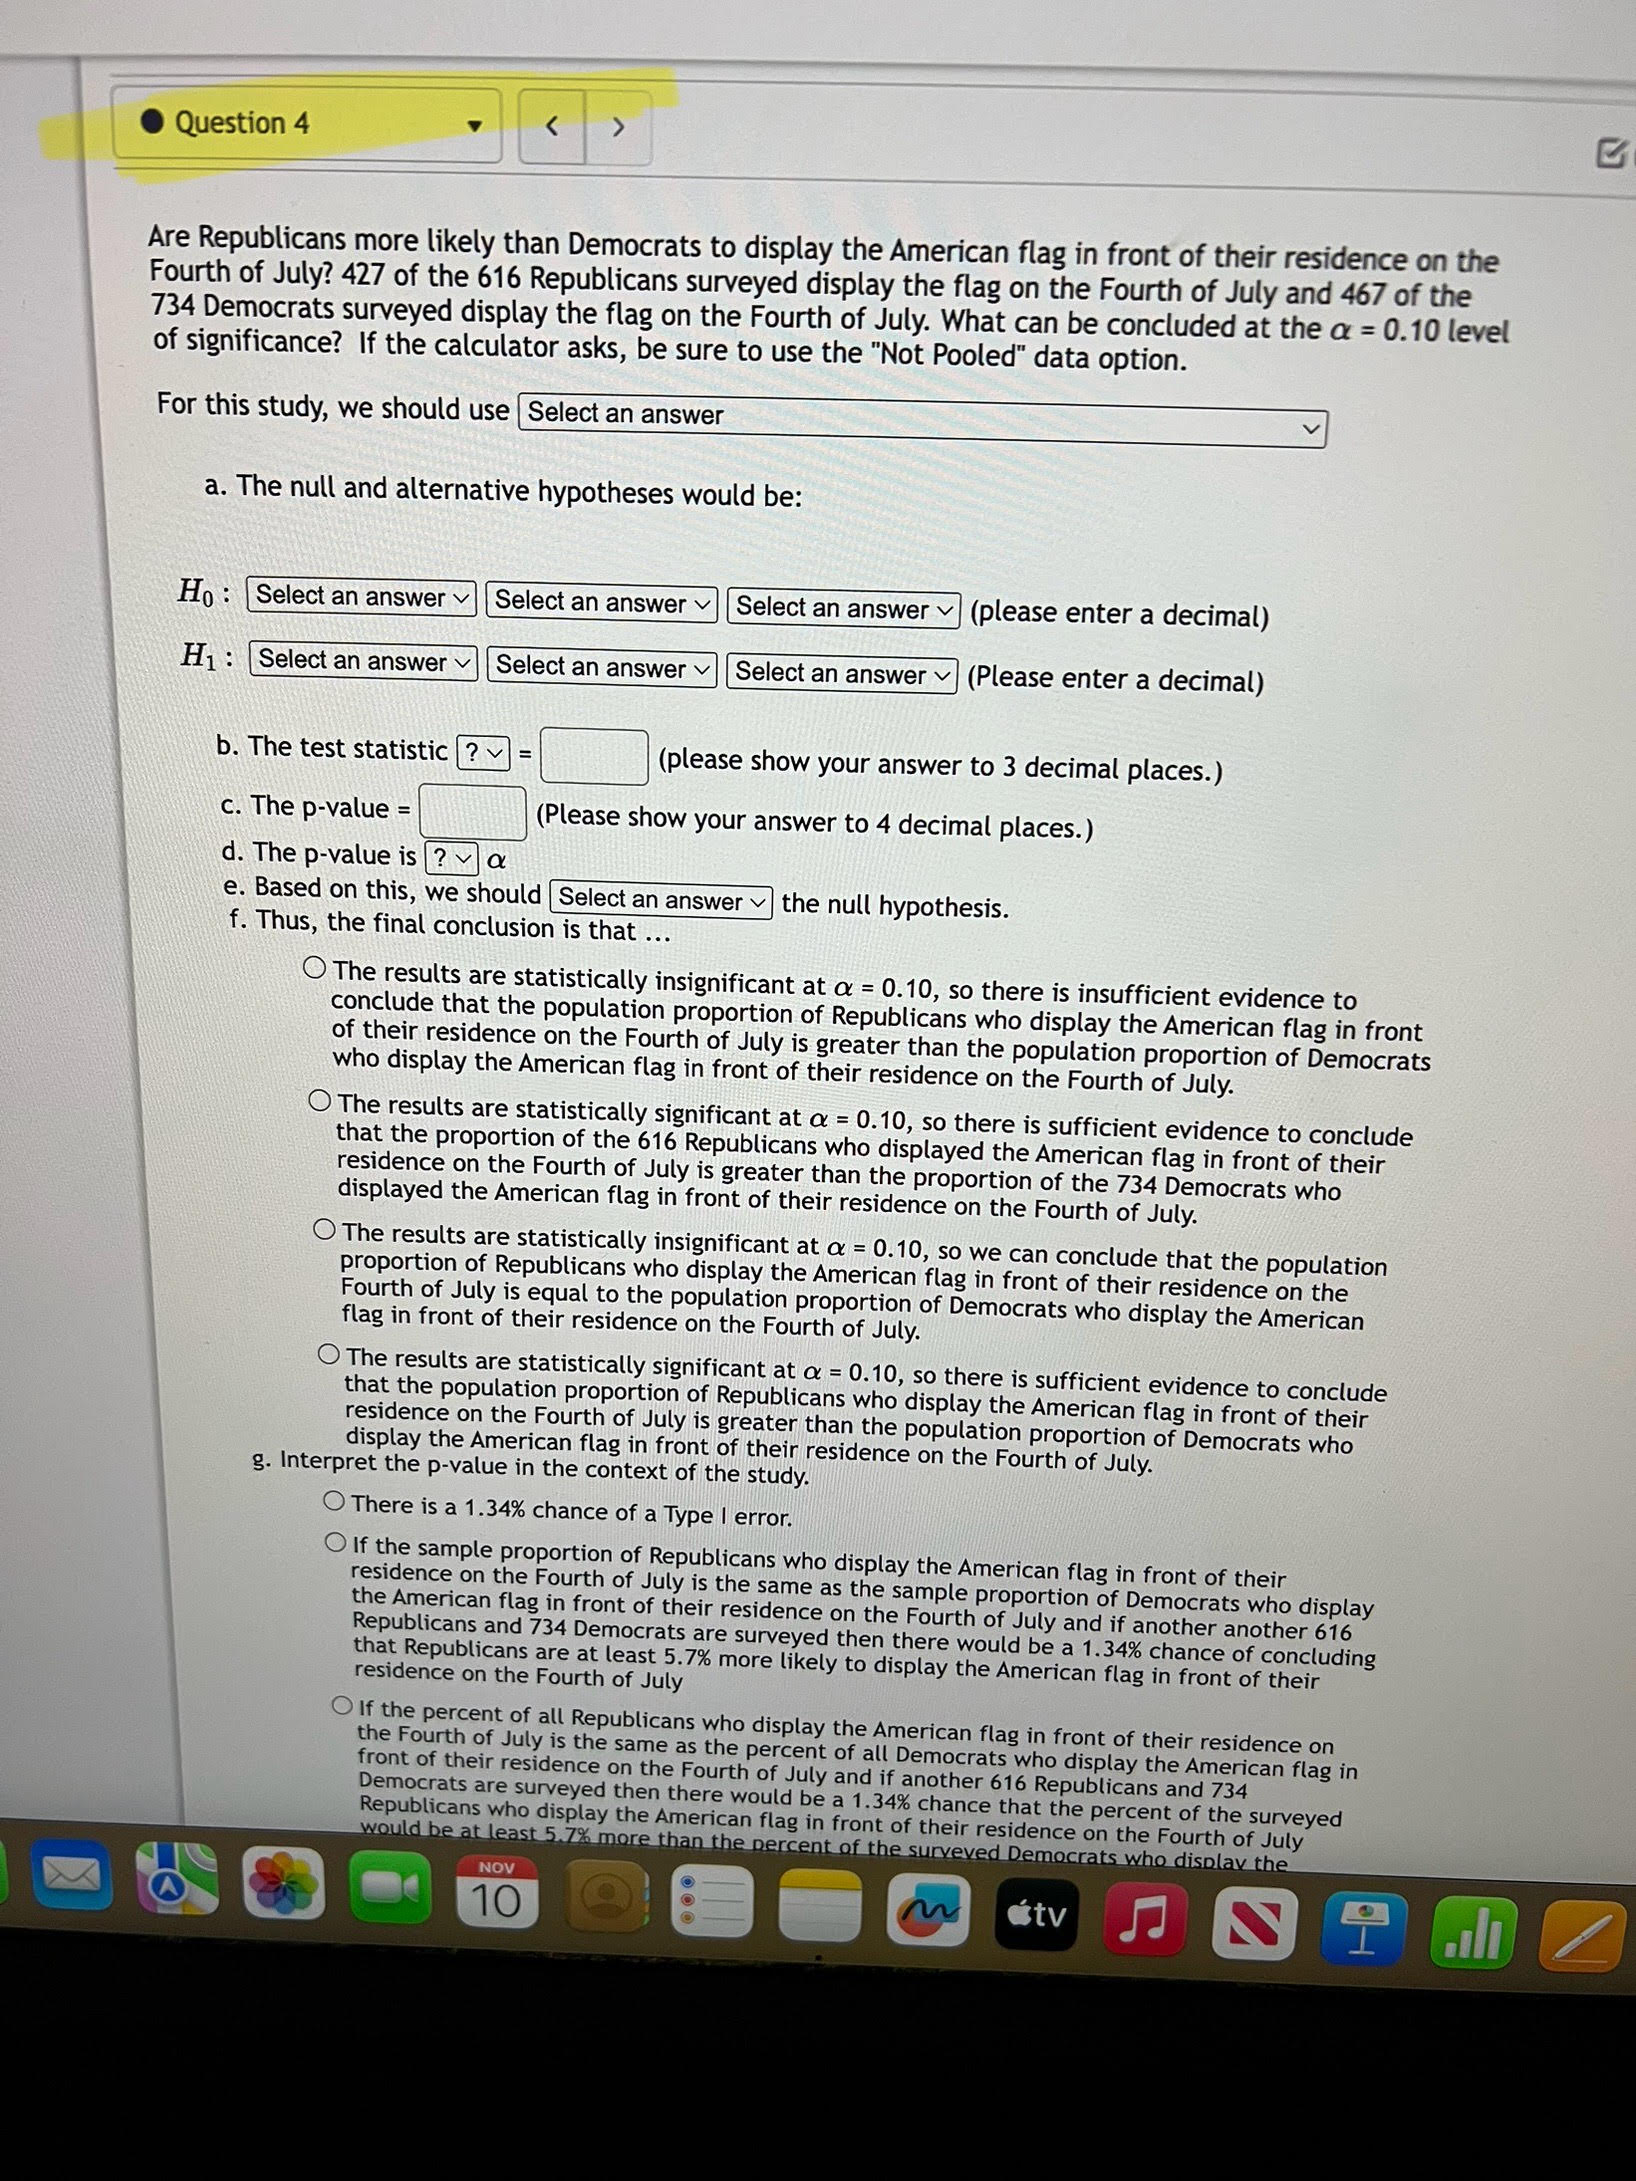
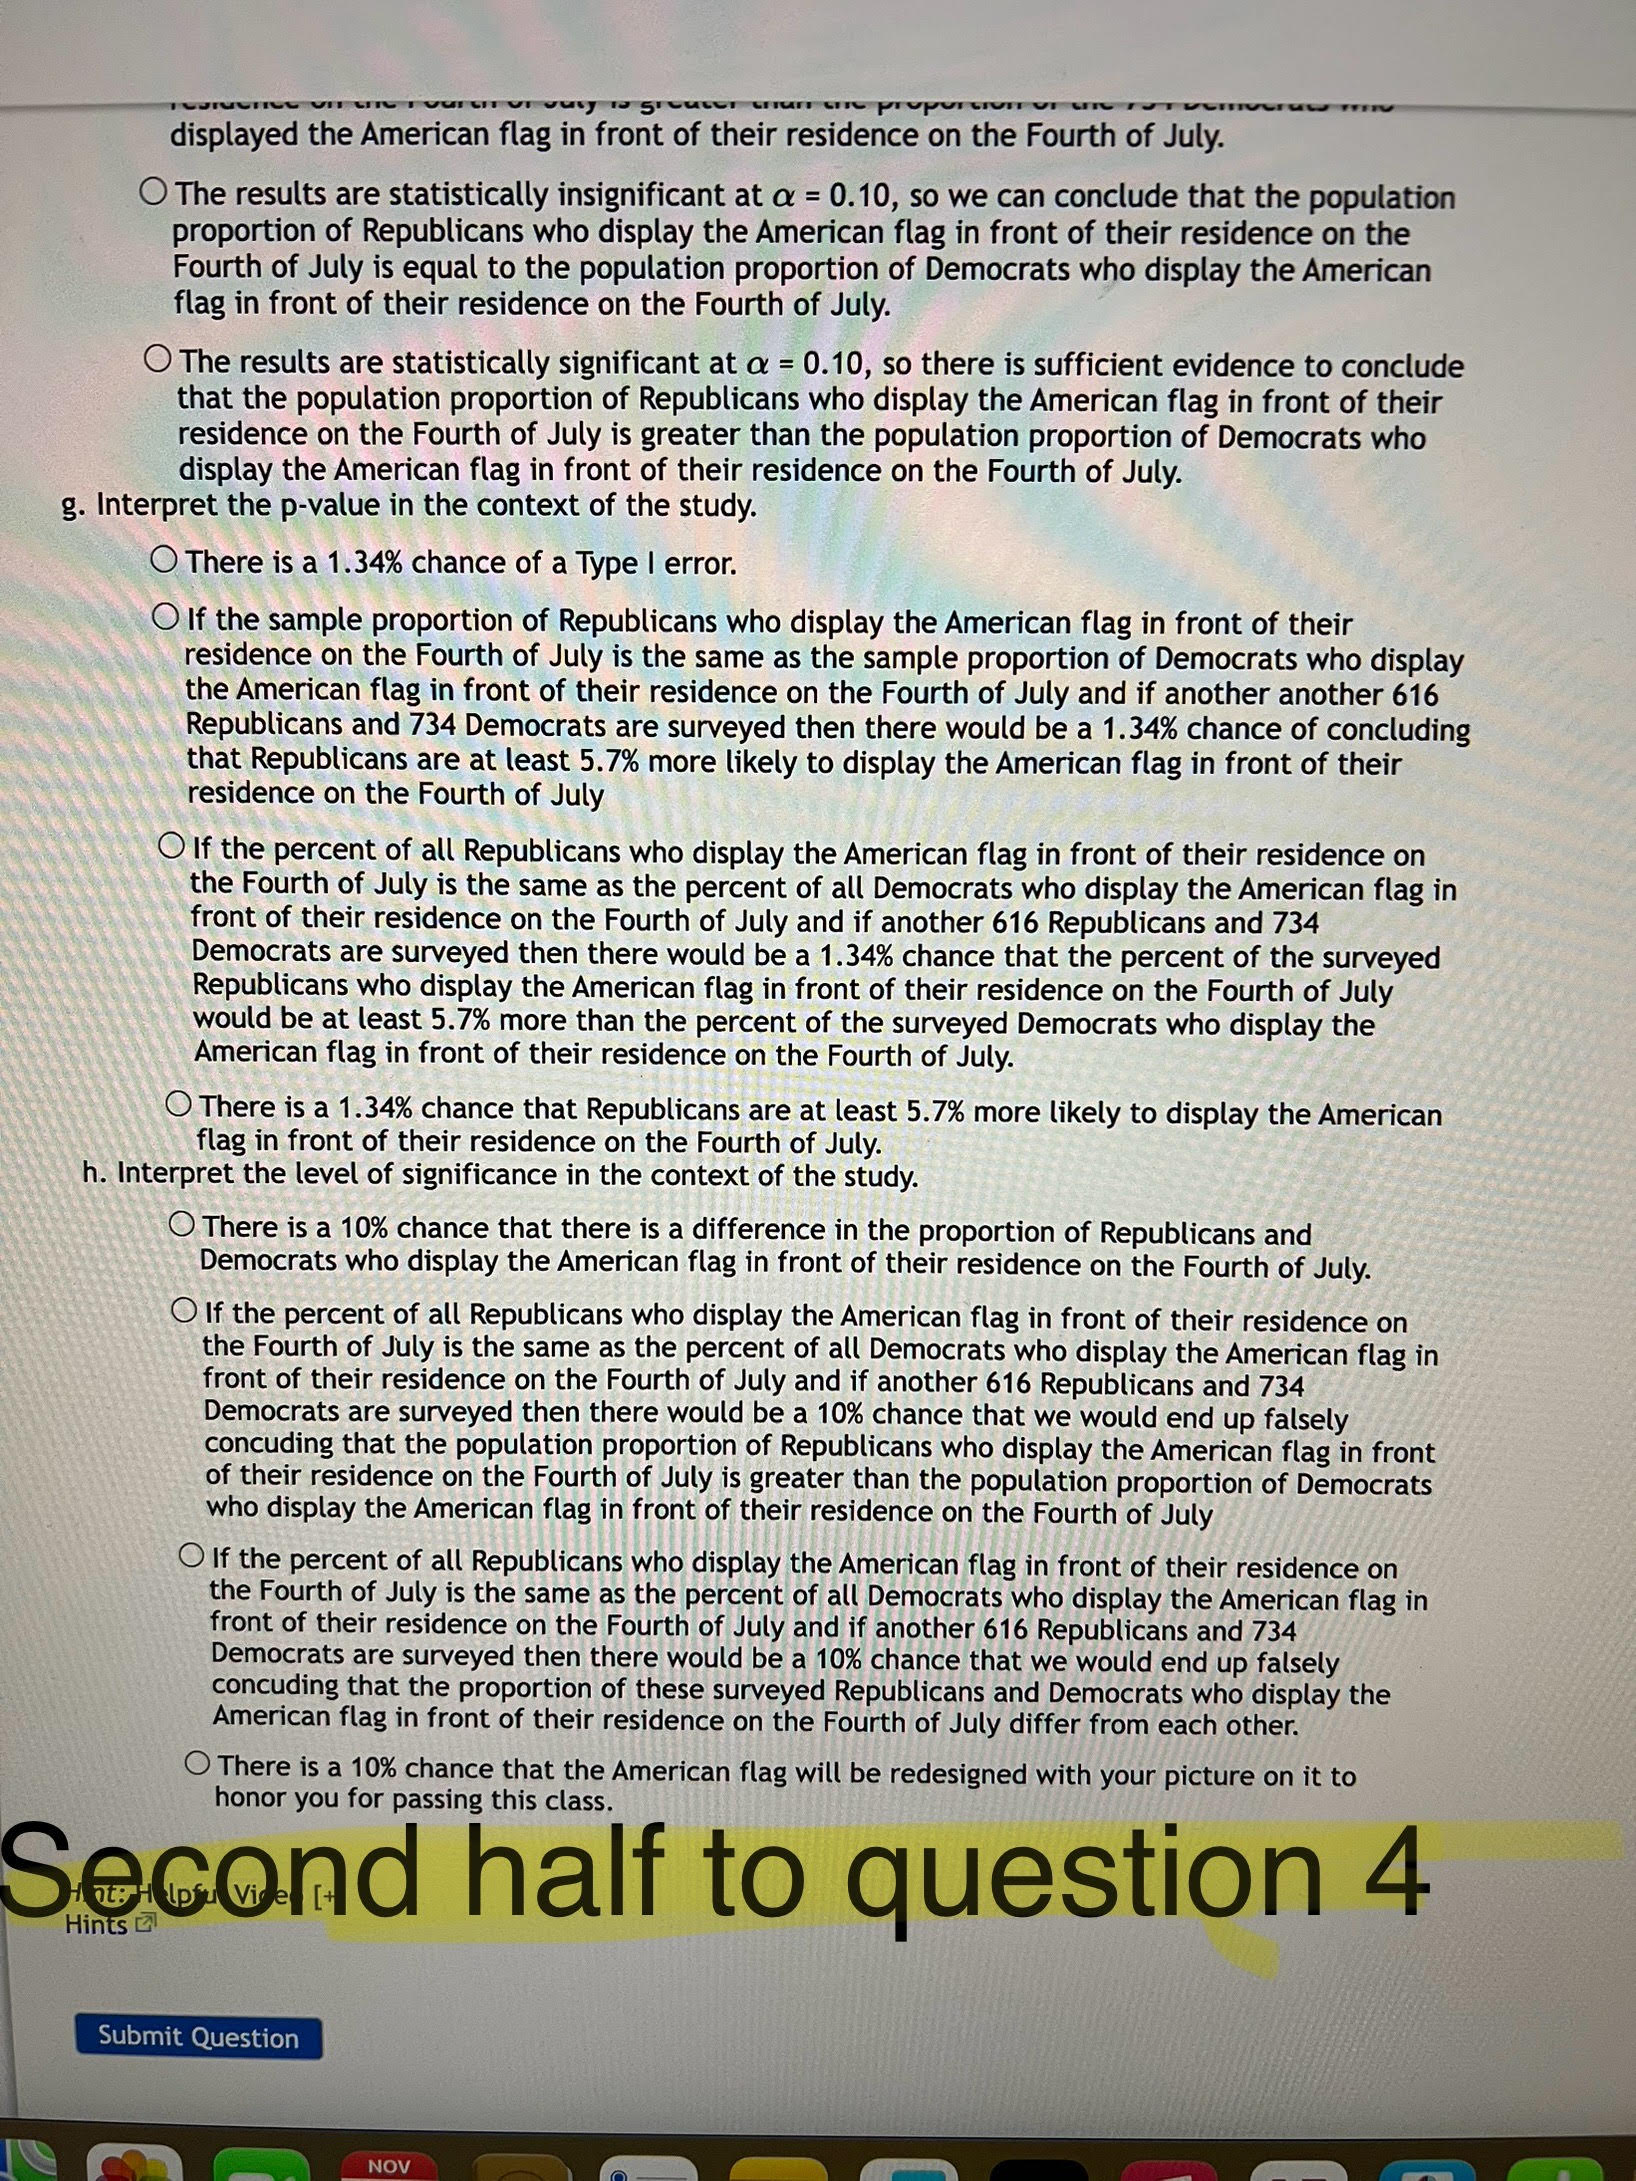
Question 2 Is the average time to complete an obstacle course shorter when a patch is placed over the right eye than when a patch is placed over the left eye? Thirteen randomly selected volunteers first completed an obstacle course with a patch over one eye and then completed an equally difficult obstacle course with a patch over the other eye. The completion times are shown below. "Left" means the patch was placed over the left eye and "Right" means the patch was placed over the right eye. Time to Complete the Course Right 46 43 43 45 45 49 46 43 Left 50 46 46 45 46 48 49 44 Assume a Normal distribution. What can be concluded at the the a = 0.05 level of significance level of significance? For this study, we should use |Select an answer a. The null and alternative hypotheses would be: Ho : Select an answer v Select an answer v Select an answer ] (please enter a decimal) H1 : Select an answer Select an answer v Select an answer | (Please enter a decimal) b. The test statistic ? = (please show your answer to 3 decimal places.) c. The p-value = (Please show your answer to 4 decimal places.) d. The p-value is ? v a e. Based on this, we should |Select an answer | the null hypothesis. f. Thus, the final conclusion is that ... The results are statistically insignificant at a = 0.05, so there is insufficient evidence to conclude that the population mean time to complete the obstacle course with a patch over the right eye is less than the population mean time to complete the obstacle course with a patch over the left eye. The results are statistically significant at a = 0.05, so there is sufficient evidence to conclude that the eight volunteers that were completed the course faster on average with the patch over the right eye compared to the left eye. The results are statistically insignificant at o = 0.05, so there is statistically significant evidence to conclude that the population mean time to complete the obstacle course with a patch over the right eye is equal to the population mean time to complete the obstacle course with a patch over the left eye. The results are statistically significant at a = 0.05, so there is sufficient evidence to conclude that the population mean time to complete the obstacle course with a patch over the right eye left eye. is less than the population mean time to complete the obstacle course with a patch over the Hint: Helpful Video ' [+] Hints NOV 10 tvlome > Statistics > Assessment Chapter 10: Hypothesis Test for a Difference Between Two Population Pro Score: 0/16 Answered: 0/4 Progress saved Done Question 1 Are couples that live together before they get married more likely to end up divorced within five years of marriage compared to couples that live apart before they get married? 248 of the 653 couples from the study who lived together before they got married were divorced within five years of marriage. 138 of the 438 couples from the study who lived apart before they got married were divorced within five years of marriage. What can be concluded at the c = 0.01 level of significance? If the calculator asks, be sure to use the "Pooled" data option. For this study, we should use |Select an answer a. The null and alternative hypotheses would be: Ho: Select an answer Select an answer Select an answer v H 1: Select an answer |Select an answer Select an answer v b. The test statistic |? = (please show your answer to 3 decimal places.) c. The p-value = (Please show your answer to 4 decimal places.) d. The p-value is ? v e. Based on this, we should |Select an answer | the null hypothesis. f. Thus, the final conclusion is that ... The results are statistically insignificant at a = 0.01, so there is insufficient evidence to conclude the percent of all couples that live together before they get married who end up divorced within five years of marriage is greater than the percent of all couples that live apart before they get married who end up divorced within five years of marriage. The results are statistically insignificant at a = 0.01, so there is statistically significant evidence to conclude that the divorce rate for all couples that live together before they get married is equal to the divorce rate for all couples that live apart before they get married. The results are statistically significant at a = 0.01, so there is sufficient evidence to conclude that the percent of the 653 couples that lived together before they got married who ended up divorced within five years of marriage is greater than the percent of the 438 couples that lived apart before they got married who ended up divorced within five years of marriage. The results are statistically significant at a = 0.01, so there is sufficient evidence to conclude that the percent of all couples that live together before they get married who end up divorced within five years of marriage is greater than the percent of all couples that live apart before they get married who end up divorced within five years of marriage. Hint: Helpful Video [+] Hints NOV 10 stvnyOpenMath Home | My Classes . | User Settings | Log Out Course Messages | Forums Calendar | Gradebook Home > Statistics > Assessment Chapter 10: Hypothesis Test for a Difference Between Two Population Score: 0/16 Answered: 0/4 Progress saved Done B & Voce Question 2 Is the proportion of wildfires caused by humans in the south lower than the proportion of wildfires caused by humans in the west? 348 of the 553 randomly selected wildfires looked at in the south were caused by humans while 358 of the 510 randomly selected wildfires looked at the west were caused by humans. What can be concluded at the a = 0.01 level of significance? If the calculator asks, be sure to use the "Pooled" data option. a. For this study, we should use |Select an answer b. The null and alternative hypotheses would be: Ho : Select an answer v Select an answer v|Select an answer v (please enter a decimal) H1 : Select an answer Select an answer v|Select an answer | (Please enter a decimal) c. The test statistic ? = (please show your answer to 3 decimal places.) d. The p-value = (Please show your answer to 4 decimal places.) e. The p-value is |? v a f. Based on this, we should |Select an answer v | the null hypothesis. g. Thus, the final conclusion is that ... The results are statistically insignificant at a = 0.01, so there is insufficient evidence to conclude that the population proportion of wildfires caused by humans in the south is lower than the population proportion of wildfires caused by humans in the west. The results are statistically significant at a = 0.01, so there is sufficient evidence to conclude that the population proportion of wildfires caused by humans in the south is lower than the population proportion of wildfires caused by humans in the west. The results are statistically significant at a = 0.01, so there is sufficient evidence to conclude that the proportion of the 553 wildfires that were caused by humans in the south is lower than the proportion of the 510 wildfires that were caused by humans in the west. The results are statistically insignificant at o = 0.01, so there is statistically significant evidence to conclude that the population proportion of wildfires caused by humans in the south is equal to the population proportion of wildfires caused by humans in the west. Hint: Helpful Video [+] Hints NOV 10 tvQuestion 3 Are job applicants with easy to pronounce last names just as likely to get called for an interview than applicants with difficult to pronounce last names. 564 job applications were sent out with last names that are easy to pronounce and 725 identical job applications were sent out with names that were difficult to pronounce. 348 of the "applicants" with easy to pronounce names were called for an interview while 419 of the "applicants" with difficult to pronounce names were called for an interview. What can be concluded at the 0.10 level of significance? If the calculator asks, be sure to use the "Not Pooled" data option. For this study, we should use |Select an answer a. The null and alternative hypotheses would be: Ho : Select an answer Select an answer Select an answer | (please enter a decimal) H1 : Select an answer v Select an answer |Select an answer (Please enter a decimal) b. The test statistic |? = (please show your answer to 3 decimal places.) c. The p-value = (Please show your answer to 4 decimal places.) d. The p-value is ? a e. Based on this, we should |Select an answer | the null hypothesis. f. Thus, the final conclusion is that ... The results are statistically insignificant at a = 0.10, so there is insufficient evidence to conclude that among all possible applicants, there is a differnece in the population proportion of callbacks for applicants with easy to pronounce last names and applicants with difficult to pronounce names. The results are statistically significant at a = 0.10, so there is sufficient evidence to conclude that among all possible applicants, there is a differnece in the population proportion of callbacks for applicants with easy to pronounce last names and applicants with difficult to pronounce names. The results are statistically significant at a = 0.10, so there is sufficient evidence to conclude that the proportion of the 564 applicants with easy to pronounce names who got called for an interview is not the same as the proportion of the 725 applicants with difficult to pronounce names who got called for an interview. The results are statistically insignificant at a = 0.10, so we can conclude that the population proportion of people with easy to pronounce names who get called for an interview is equal to the population proportion of people with difficult to pronounce names who get called for an interview. g. Interpret the p-value in the context of the study. If the population proportion of callbacks for applicants with easy to pronounce last names is the same as the population proportion of callbacks for applicants with difficult to pronounce last names and if another 564 applications with easy to pronounce names and 725 applications with difficult to pronounce names are submitted then there would be a 15.5% chance that the percent of callbacks for the sample of applicants with easy to pronounce names and the percent of callbacks for the sample of applicants with difficult to pronounce names would differ by at least 3.9%. If the sample proportion of applicants with easy to pronounce names who receive a callback is the same as the sample proportion of applicants with difficult to pronounce names who receive a callback and if another another 564 applications with easy to pronounce names and 725 cluding that the applications with difficult to pronounce names are submitted then there would be a 15.5% NOV applicante with an 10 tvof callbacks for applicants with easy to pronounce last names and applicants with difficult to pronounce names. The results are statistically significant at a = 0.10, so there is sufficient evidence to conclude that among all possible applicants, there is a differnece in the population proportion of callbacks for applicants with easy to pronounce last names and applicants with difficult to pronounce names. O The results are statistically significant at a = 0.10, so there is sufficient evidence to conclude that the proportion of the 564 applicants with easy to pronounce names who got called for an interview is not the same as the proportion of the 725 applicants with difficult to pronounce names who got called for an interview. The results are statistically insignificant at a = 0.10, so we can conclude that the population proportion of people with easy to pronounce names who get called for an interview is equal to the population proportion of people with difficult to pronounce names who get called for an interview. g. Interpret the p-value in the context of the study. If the population proportion of callbacks for applicants with easy to pronounce last names is the same as the population proportion of callbacks for applicants with difficult to pronounce last names and if another 564 applications with easy to pronounce names and 725 applications with difficult to pronounce names are submitted then there would be a 15.5% chance that the percent of callbacks for the sample of applicants with easy to pronounce names and the percent of callbacks for the sample of applicants with difficult to pronounce names would differ by at least 3.9%. If the sample proportion of applicants with easy to pronounce names who receive a callback is the same as the sample proportion of applicants with difficult to pronounce names who receive a callback and if another another 564 applications with easy to pronounce names and 725 applications with difficult to pronounce names are submitted then there would be a 15.5% chance of concluding that the percent callbacks for applicants with easy to pronounce names and applicants with difficult to pronounce names differ by at least 3.9% . There is a 15.5% chance of a Type | error. There is a 15.5% chance that percent of callbacks for applicants with easy to pronounce names and those with difficult to pronounce names differ by at least 3.9%. h. Interpret the level of significance in the context of the study. There is a 10% chance that the manager's son will get the job, so it is pointless to apply no matter what your last name is. If the population proportion of callbacks for applicants with easy to pronounce last names is the same as the population proportion of callbacks for applicants with difficult to pronounce last names and if another 564 applications with easy to pronounce names and 725 applications with difficult to pronounce names are submitted then there would be a 10% chance that we would end up falsely concuding that the population proportion of callbacks for applicants with easy to pronounce last names is different from the population proportion of callbacks for applicants with difficult to pronounce last names. If the population proportion of callbacks for applicants with easy to pronounce last names is the same as the population proportion of callbacks for applicants with difficult to pronounce last names and if another 564 applications with easy to pronounce names and 725 applications with difficult to pronounce names are submitted then there would be a 10% chance that we would end up falsely concuding that the proportion of callbacks for the submitted applications with easy to pronounce last names is different from the proportion of callbacks for the submitted applications with difficult to pronounce last names. Hint: Helpful Video [+] Hints 2nd half question 3 NOVQuestion 4 Are Republicans more likely than Democrats to display the American flag in front of their residence on the Fourth of July? 427 of the 616 Republicans surveyed display the flag on the Fourth of July and 467 of the 734 Democrats surveyed display the flag on the Fourth of July. What can be concluded at the a = 0.10 level of significance? If the calculator asks, be sure to use the "Not Pooled" data option. For this study, we should use Select an answer a. The null and alternative hypotheses would be: Ho : Select an answer | Select an answer Select an answer v (please enter a decimal) H1 : Select an answer Select an answer | Select an answer (Please enter a decimal) b. The test statistic |? = (please show your answer to 3 decimal places.) c. The p-value = (Please show your answer to 4 decimal places.) d. The p-value is ? a e. Based on this, we should |Select an answer | the null hypothesis. f. Thus, the final conclusion is that ... The results are statistically insignificant at a = 0.10, so there is insufficient evidence to conclude that the population proportion of Republicans who display the American flag in front of their residence on the Fourth of July is greater than the population proportion of Democrats who display the American flag in front of their residence on the Fourth of July. The results are statistically significant at a = 0.10, so there is sufficient evidence to conclude that the proportion of the 616 Republicans who displayed the American flag in front of their residence on the Fourth of July is greater than the proportion of the 734 Democrats who displayed the American flag in front of their residence on the Fourth of July. The results are statistically insignificant at a = 0.10, so we can conclude that the population proportion of Republicans who display the American flag in front of their residence on the Fourth of July is equal to the population proportion of Democrats who display the American flag in front of their residence on the Fourth of July. The results are statistically significant at a = 0.10, so there is sufficient evidence to conclude that the population proportion of Republicans who display the American flag in front of their residence on the Fourth of July is greater than the population proportion of Democrats who display the American flag in front of their residence on the Fourth of July. g. Interpret the p-value in the context of the study. There is a 1.34% chance of a Type | error. If the sample proportion of Republicans who display the American flag in front of their residence on the Fourth of July is the same as the sample proportion of Democrats who display the American flag in front of their residence on the Fourth of July and if another another 616 Republicans and 734 Democrats are surveyed then there would be a 1.34% chance of concluding that Republicans are at least 5.7% more likely to display the American flag in front of their residence on the Fourth of July If the percent of all Republicans who display the American flag in front of their residence on the Fourth of July is the same as the percent of all Democrats who display the American flag in front of their residence on the Fourth of July and if another 616 Republicans and 734 Democrats are surveyed then there would be a 1.34% chance that the percent of the surveyed Republicans who display the American flag in front of their residence on the Fourth of July would be at least 5.7% more than the percent of the surveyed Democrats who display the NOV 10A TR T WM R T W WM Y TS S S MRS T R T ST TS T W T ST W R e e e T TR S T displayed the American flag in front of their residence on the Fourth of July. O The results are statistically insignificant at a = 0.10, so we can conclude that the population proportion of Republicans who display the American flag in front of their residence on the Fourth of July is equal to the population proportion of Democrats who display the American flag in front of their residence on the Fourth of July. O The results are statistically significant at a = 0.10, so there is sufficient evidence to conclude that the population proportion of Republicans who display the American flag in front of their residence on the Fourth of July is greater than the population proportion of Democrats who display the American flag in front of their residence on the Fourth of July. g. Interpret the p-value in the context of the study. O There is a 1.34% chance of a Type | error. O If the sample proportion of Republicans who display the American flag in front of their residence on the Fourth of July is the same as the sample proportion of Democrats who display the American flag in front of their residence on the Fourth of July and if another another 616 Republicans and 734 Democrats are surveyed then there would be a 1.34% chance of concluding that Republicans are at least 5.7% more likely to display the American flag in front of their residence on the Fourth of July QO If the percent of all Republicans who display the American flag in front of their residence on the Fourth of July is the same as the percent of all Democrats who display the American flag in front of their residence on the Fourth of July and if another 616 Republicans and 734 Democrats are surveyed then there would be a 1.34% chance that the percent of the surveyed Republicans who display the American flag in front of their residence on the Fourth of July would be at least 5.7% more than the percent of the surveyed Democrats who display the American flag in front of their residence on the Fourth of July. O There is a 1.34% chance that Republicans are at least 5.7% more likely to display the American flag in front of their residence on the Fourth of July. h. Interpret the level of significance in the context of the study. O There is a 10% chance that there is a difference in the proportion of Republicans and Democrats who display the American flag in front of their residence on the Fourth of July. O If the percent of all Republicans who display the American flag in front of their residence on the Fourth of July is the same as the percent of all Democrats who display the American flag in front of their residence on the Fourth of July and if another 616 Republicans and 734 Democrats are surveyed then there would be a 10% chance that we would end up falsely concuding that the population proportion of Republicans who display the American flag in front of their residence on the Fourth of July is greater than the population proportion of Democrats who display the American flag in front of their residence on the Fourth of July O If the percent of all Republicans who display the American flag in front of their residence on the Fourth of July is the same as the percent of all Democrats who display the American flag in front of their residence on the Fourth of July and if another 616 Republicans and 734 Democrats are surveyed then there would be a 10% chance that we would end up falsely concuding that the proportion of these surveyed Republicans and Democrats who display the American flag in front of their residence on the Fourth of July differ from each other. O There is a 10% chance that the American flag will be redesigned with your picture on it to honor you for passing this class. ond half to question 4 I oTe VOV T I A o)
Step by Step Solution
There are 3 Steps involved in it
1 Expert Approved Answer
Step: 1 Unlock
Question Has Been Solved by an Expert!
Get step-by-step solutions from verified subject matter experts
Step: 2 Unlock
Step: 3 Unlock
Students Have Also Explored These Related Mathematics Questions!