Question: QUESTION 2: LP Formulation (21 points) Power Generation Inc. has just announced the March 1, 2022 expansion of the R.H. Saunders Generating Station in the
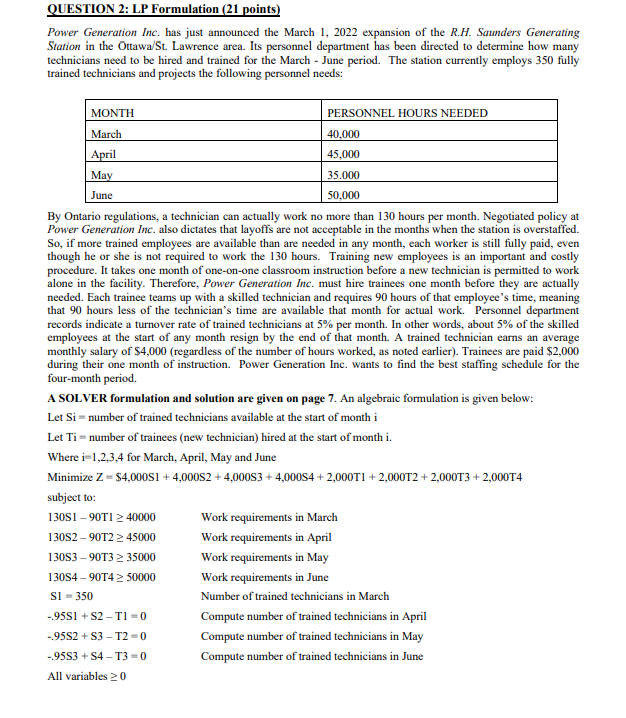
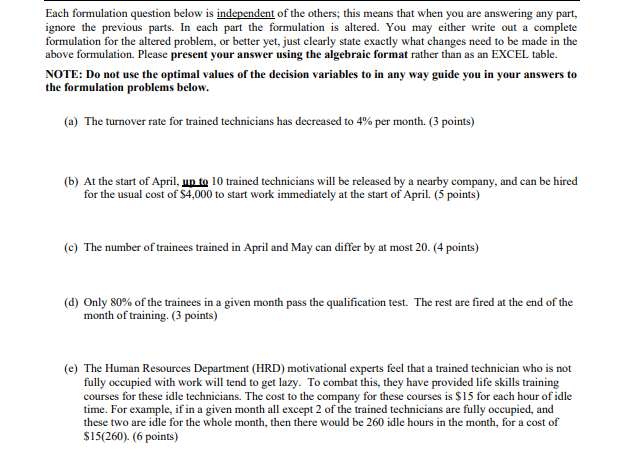
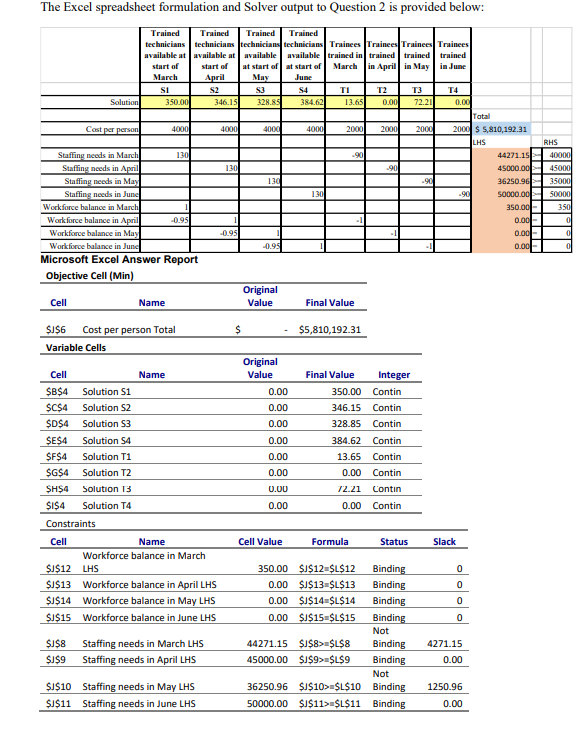
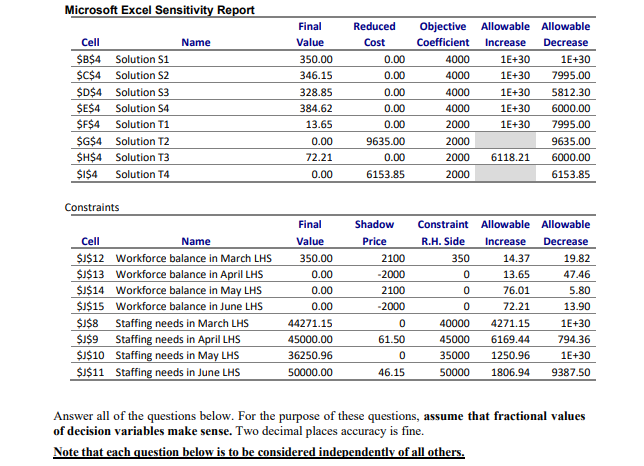
QUESTION 2: LP Formulation (21 points) Power Generation Inc. has just announced the March 1, 2022 expansion of the R.H. Saunders Generating Station in the Ottawa/St. Lawrence area. Its personnel department has been directed to determine how many technicians need to be hired and trained for the March - June period. The station currently employs 350 fully trained technicians and projects the following personnel needs: June MONTH PERSONNEL HOURS NEEDED March 40.000 April 45,000 May 35.000 50,000 By Ontario regulations, a technician can actually work no more than 130 hours per month. Negotiated policy at Power Generation Inc. also dictates that layoffs are not acceptable in the months when the station is overstaffed. So, if more trained employees are available than are needed in any month, each worker is still fully paid, even though he or she is not required to work the 130 hours. Training new employees is an important and costly procedure. It takes one month of one-on-one classroom instruction before a new technician is permitted to work alone in the facility. Therefore, Power Generation Inc. must hire trainees one month before they are actually needed. Each trainee teams up with a skilled technician and requires 90 hours of that employee's time, meaning that 90 hours less of the technician's time are available that month for actual work. Personnel department records indicate a turnover rate of trained technicians at 5% per month. In other words, about 5% of the skilled employees at the start of any month resign by the end of that month. A trained technician earns an average monthly salary of $4,000 (regardless of the number of hours worked, as noted earlier). Trainees are paid $2,000 during their one month of instruction. Power Generation Inc. wants to find the best staffing schedule for the four-month period. A SOLVER formulation and solution are given on page 7. An algebraic formulation is given below: Let Si = number of trained technicians available at the start of month i Let Ti = number of trainees (new technician) hired at the start of month i. Where i-1,2,3,4 for March April, May and June Minimize Z = $4,00081 +4,00052 +4,000S3 + 4,000S4 + 2,000T1 + 2,000T2 + 2,000T3 + 2,000T4 subject to: 13051 - 90T1 2 40000 Work requirements in March 13052 - 90T2 > 45000 Work requirements in April 13053 - 9013 > 35000 Work requirements in May 13054 - 90T4 2 50000 Work requirements in June SI - 350 Number of trained technicians in March -95S1 + S2-TI-0 Compute number of trained technicians in April -95S2 + S3 - T2 - 0 Compute number of trained technicians in May -9553 +S4 -T3-0 Compute number of trained technicians in June All variables 20 Each formulation question below is independent of the others; this means that when you are answering any part, ignore the previous parts. In each part the formulation is altered. You may either write out a complete formulation for the altered problem, or better yet, just clearly state exactly what changes need to be made in the above formulation. Please present your answer using the algebraic format rather than as an EXCEL table. NOTE: Do not use the optimal values of the decision variables to in any way guide you in your answers to the formulation problems below. (a) The turnover rate for trained technicians has decreased to 4% per month. (3 points) (b) At the start of April, up to 10 trained technicians will be released by a nearby company, and can be hired for the usual cost of $4,000 to start work immediately at the start of April. (5 points) (c) The number of trainees trained in April and May can differ by at most 20. (4 points) (d) Only 80% of the trainees in a given month pass the qualification test. The rest are fired at the end of the month of training. (3 points) (e) The Human Resources Department (HRD) motivational experts feel that a trained technician who is not fully occupied with work will tend to get lazy. To combat this, they have provided life skills training courses for these idle technicians. The cost to the company for these courses is $15 for each hour of idle time. For example, if in a given month all except 2 of the trained technicians are fully occupied, and these two are idle for the whole month, then there would be 260 idle hours in the month, for a cost of $15(260). (6 points) The Excel spreadsheet formulation and Solver output to Question 2 is provided below: 4000 RHS 40000 Trained Trained Trained Trained technicians technicians technicians technicians Trainees Trainees Trainees Trainees available at available at available available trained in trained trained trained start of start of at start of at start of March in April in May in June March April May June SI S2 S3 S4 TI T2 T3 T4 Solution 350.00 346.15 328.85 384.62 13.65 0100 72.21 0.00 Total Cast per person 4000 4000 4000 2000 2000 2000 2000 $ 5,810,192.31 LHS Staffing needs in March 130 .90 44271.15 Staffing needs in April 130 .90 45000.00 Staffing needs in May 130 .90 36250.96 Staffing needs in June 130 .90 50000.00 Workforce balance in March 350.00 Workforce balance in April -0.95 0.00 Workforce balance in May -0.95 0.00 Workforce balance in June 0.00 Microsoft Excel Answer Report Objective Cell (Min) Original Cell Name Value Final Value 45000 35000 50000 350 0 0 -0.95 0 $ $5,810,192.31 $J$6 Cost per person Total Variable Cells Original Value 0.00 0.00 0.00 0.00 0.00 0.00 Final Value Integer 350.00 Contin 346.15 Contin 328.85 Contin 384.62 Contin 13.65 Contin 0.00 Contin 72.21 Contin 0.00 Contin 0.00 0.00 Cell Name $B$4 Solution S1 $C$4 Solution S2 $D$4 Solution S3 $E$4 Solution S4 $F$4 Solution T1 SG$4 Solution T2 SH$4 Solution 13 $I$4 Solution T4 Constraints Cell Name Workforce balance in March $J$12 LHS $J$13 Workforce balance in April LHS $J$14 Workforce balance in May LHS $J$15 Workforce balance in June LHS $J$8 Staffing needs in March LHS $J$9 Staffing needs in April LHS $J$10 Staffing needs in May LHS $J$11 Staffing needs in June LHS Cell Value Formula Status Slack 0 0 0 0 350.00 $J$12=$L$12 Binding 0.00 $J$13-$L$13 Binding 0.00 $J$14=$L$14 Binding 0.00 $J$15=$L$15 Binding Not 44271.15 $J$8>=$L$8 Binding 45000.00 $1$9>=$L$9 Binding Not 36250.96 $J$10>$L$10 Binding 50000.00 $J$11>$L$11 Binding 4271.15 0.00 1250.96 0.00 Microsoft Excel Sensitivity Report Name Cell $B$4 Solution S1 $C$4 Solution S2 $D$4 Solution 3 $E$4 Solution 54 $F$4 Solution T1 $G$4 Solution T2 $H$4 Solution T3 $1$4 Solution T4 Final Value 350.00 346.15 328.85 384.62 13.65 0.00 72.21 0.00 Reduced Cost 0.00 0.00 0.00 0.00 0.00 9635.00 0.00 6153.85 Objective Coefficient 4000 4000 4000 4000 2000 2000 2000 2000 Allowable Allowable Increase Decrease 1E+30 1E+30 1E+30 7995.00 1E+30 5812.30 1E+30 6000.00 1E+30 7995.00 9635.00 6118.21 6000.00 6153.85 Constraints Cell Name $J$12 Workforce balance in March LHS $J$13 Workforce balance in April LHS $J$14 Workforce balance in May LHS $J$15 Workforce balance in June LHS $J$8 Staffing needs in March LHS $J$9 Staffing needs in April LHS $J$10 Staffing needs in May LHS $J$11 Staffing needs in June LHS Final Value 350.00 0.00 0.00 0.00 44271.15 45000.00 36250.96 50000.00 Shadow Price 2100 -2000 2100 -2000 0 61.50 0 Constraint Allowable Allowable R.H. Side Increase Decrease 350 14.37 19.82 0 13.65 47.46 0 76.01 5.80 0 72.21 13.90 40000 4271.15 1E+30 45000 6169.44 794.36 35000 1250.96 1E+30 50000 1806.94 9387.50 46.15 Answer all of the questions below. For the purpose of these questions, assume that fractional values of decision variables make sense. Two decimal places accuracy is fine. Note that each question below is to be considered independently of all others. QUESTION 2: LP Formulation (21 points) Power Generation Inc. has just announced the March 1, 2022 expansion of the R.H. Saunders Generating Station in the Ottawa/St. Lawrence area. Its personnel department has been directed to determine how many technicians need to be hired and trained for the March - June period. The station currently employs 350 fully trained technicians and projects the following personnel needs: June MONTH PERSONNEL HOURS NEEDED March 40.000 April 45,000 May 35.000 50,000 By Ontario regulations, a technician can actually work no more than 130 hours per month. Negotiated policy at Power Generation Inc. also dictates that layoffs are not acceptable in the months when the station is overstaffed. So, if more trained employees are available than are needed in any month, each worker is still fully paid, even though he or she is not required to work the 130 hours. Training new employees is an important and costly procedure. It takes one month of one-on-one classroom instruction before a new technician is permitted to work alone in the facility. Therefore, Power Generation Inc. must hire trainees one month before they are actually needed. Each trainee teams up with a skilled technician and requires 90 hours of that employee's time, meaning that 90 hours less of the technician's time are available that month for actual work. Personnel department records indicate a turnover rate of trained technicians at 5% per month. In other words, about 5% of the skilled employees at the start of any month resign by the end of that month. A trained technician earns an average monthly salary of $4,000 (regardless of the number of hours worked, as noted earlier). Trainees are paid $2,000 during their one month of instruction. Power Generation Inc. wants to find the best staffing schedule for the four-month period. A SOLVER formulation and solution are given on page 7. An algebraic formulation is given below: Let Si = number of trained technicians available at the start of month i Let Ti = number of trainees (new technician) hired at the start of month i. Where i-1,2,3,4 for March April, May and June Minimize Z = $4,00081 +4,00052 +4,000S3 + 4,000S4 + 2,000T1 + 2,000T2 + 2,000T3 + 2,000T4 subject to: 13051 - 90T1 2 40000 Work requirements in March 13052 - 90T2 > 45000 Work requirements in April 13053 - 9013 > 35000 Work requirements in May 13054 - 90T4 2 50000 Work requirements in June SI - 350 Number of trained technicians in March -95S1 + S2-TI-0 Compute number of trained technicians in April -95S2 + S3 - T2 - 0 Compute number of trained technicians in May -9553 +S4 -T3-0 Compute number of trained technicians in June All variables 20 Each formulation question below is independent of the others; this means that when you are answering any part, ignore the previous parts. In each part the formulation is altered. You may either write out a complete formulation for the altered problem, or better yet, just clearly state exactly what changes need to be made in the above formulation. Please present your answer using the algebraic format rather than as an EXCEL table. NOTE: Do not use the optimal values of the decision variables to in any way guide you in your answers to the formulation problems below. (a) The turnover rate for trained technicians has decreased to 4% per month. (3 points) (b) At the start of April, up to 10 trained technicians will be released by a nearby company, and can be hired for the usual cost of $4,000 to start work immediately at the start of April. (5 points) (c) The number of trainees trained in April and May can differ by at most 20. (4 points) (d) Only 80% of the trainees in a given month pass the qualification test. The rest are fired at the end of the month of training. (3 points) (e) The Human Resources Department (HRD) motivational experts feel that a trained technician who is not fully occupied with work will tend to get lazy. To combat this, they have provided life skills training courses for these idle technicians. The cost to the company for these courses is $15 for each hour of idle time. For example, if in a given month all except 2 of the trained technicians are fully occupied, and these two are idle for the whole month, then there would be 260 idle hours in the month, for a cost of $15(260). (6 points) The Excel spreadsheet formulation and Solver output to Question 2 is provided below: 4000 RHS 40000 Trained Trained Trained Trained technicians technicians technicians technicians Trainees Trainees Trainees Trainees available at available at available available trained in trained trained trained start of start of at start of at start of March in April in May in June March April May June SI S2 S3 S4 TI T2 T3 T4 Solution 350.00 346.15 328.85 384.62 13.65 0100 72.21 0.00 Total Cast per person 4000 4000 4000 2000 2000 2000 2000 $ 5,810,192.31 LHS Staffing needs in March 130 .90 44271.15 Staffing needs in April 130 .90 45000.00 Staffing needs in May 130 .90 36250.96 Staffing needs in June 130 .90 50000.00 Workforce balance in March 350.00 Workforce balance in April -0.95 0.00 Workforce balance in May -0.95 0.00 Workforce balance in June 0.00 Microsoft Excel Answer Report Objective Cell (Min) Original Cell Name Value Final Value 45000 35000 50000 350 0 0 -0.95 0 $ $5,810,192.31 $J$6 Cost per person Total Variable Cells Original Value 0.00 0.00 0.00 0.00 0.00 0.00 Final Value Integer 350.00 Contin 346.15 Contin 328.85 Contin 384.62 Contin 13.65 Contin 0.00 Contin 72.21 Contin 0.00 Contin 0.00 0.00 Cell Name $B$4 Solution S1 $C$4 Solution S2 $D$4 Solution S3 $E$4 Solution S4 $F$4 Solution T1 SG$4 Solution T2 SH$4 Solution 13 $I$4 Solution T4 Constraints Cell Name Workforce balance in March $J$12 LHS $J$13 Workforce balance in April LHS $J$14 Workforce balance in May LHS $J$15 Workforce balance in June LHS $J$8 Staffing needs in March LHS $J$9 Staffing needs in April LHS $J$10 Staffing needs in May LHS $J$11 Staffing needs in June LHS Cell Value Formula Status Slack 0 0 0 0 350.00 $J$12=$L$12 Binding 0.00 $J$13-$L$13 Binding 0.00 $J$14=$L$14 Binding 0.00 $J$15=$L$15 Binding Not 44271.15 $J$8>=$L$8 Binding 45000.00 $1$9>=$L$9 Binding Not 36250.96 $J$10>$L$10 Binding 50000.00 $J$11>$L$11 Binding 4271.15 0.00 1250.96 0.00 Microsoft Excel Sensitivity Report Name Cell $B$4 Solution S1 $C$4 Solution S2 $D$4 Solution 3 $E$4 Solution 54 $F$4 Solution T1 $G$4 Solution T2 $H$4 Solution T3 $1$4 Solution T4 Final Value 350.00 346.15 328.85 384.62 13.65 0.00 72.21 0.00 Reduced Cost 0.00 0.00 0.00 0.00 0.00 9635.00 0.00 6153.85 Objective Coefficient 4000 4000 4000 4000 2000 2000 2000 2000 Allowable Allowable Increase Decrease 1E+30 1E+30 1E+30 7995.00 1E+30 5812.30 1E+30 6000.00 1E+30 7995.00 9635.00 6118.21 6000.00 6153.85 Constraints Cell Name $J$12 Workforce balance in March LHS $J$13 Workforce balance in April LHS $J$14 Workforce balance in May LHS $J$15 Workforce balance in June LHS $J$8 Staffing needs in March LHS $J$9 Staffing needs in April LHS $J$10 Staffing needs in May LHS $J$11 Staffing needs in June LHS Final Value 350.00 0.00 0.00 0.00 44271.15 45000.00 36250.96 50000.00 Shadow Price 2100 -2000 2100 -2000 0 61.50 0 Constraint Allowable Allowable R.H. Side Increase Decrease 350 14.37 19.82 0 13.65 47.46 0 76.01 5.80 0 72.21 13.90 40000 4271.15 1E+30 45000 6169.44 794.36 35000 1250.96 1E+30 50000 1806.94 9387.50 46.15 Answer all of the questions below. For the purpose of these questions, assume that fractional values of decision variables make sense. Two decimal places accuracy is fine. Note that each question below is to be considered independently of all others


