

Question: Question 2 Normal 8% 7% 6% + 5% Yield 4%+ 3% + 2%+ 1% + 25 30 10 15 20 Time to Maturity (in years)
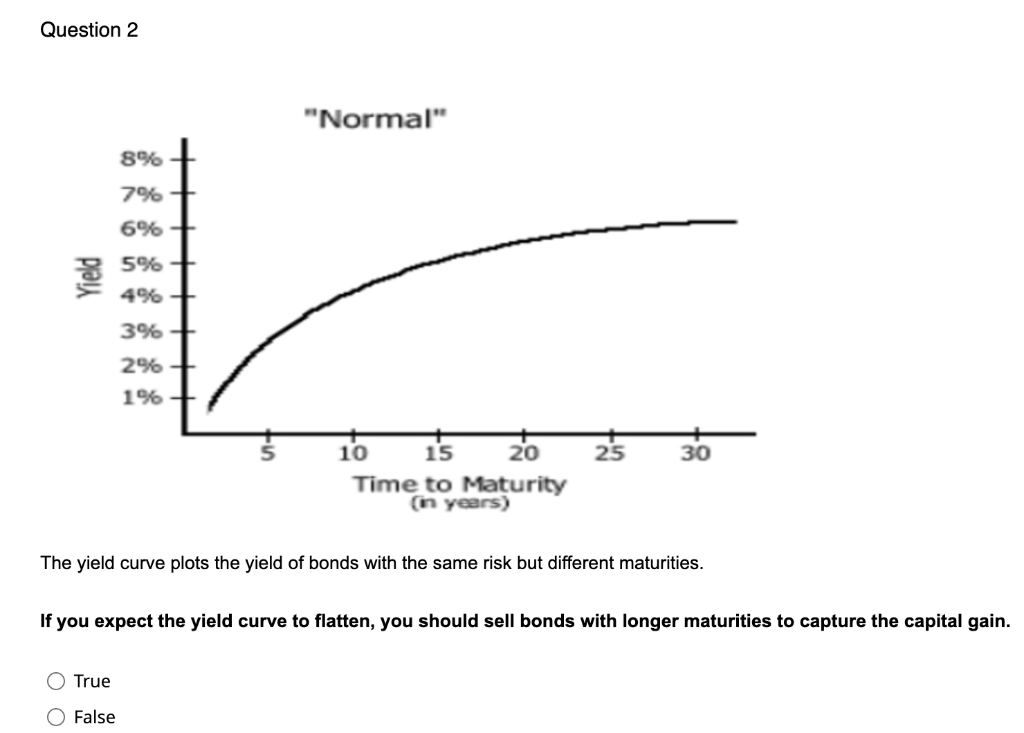
Question 2 "Normal" 8% 7% 6% + 5% Yield 4%+ 3% + 2%+ 1% + 25 30 10 15 20 Time to Maturity (in years) The yield curve plots the yield of bonds with the same risk but different maturities. If you expect the yield curve to flatten, you should sell bonds with longer maturities to capture the capital gain. O True False
Step by Step Solution
There are 3 Steps involved in it
1 Expert Approved Answer
Step: 1 Unlock

Question Has Been Solved by an Expert!
Get step-by-step solutions from verified subject matter experts
Step: 2 Unlock
Step: 3 Unlock