

Question: Question 2 Note: You are expected to use some sort of computational software to answer this question. MATLAB and Python are good options. Excel is
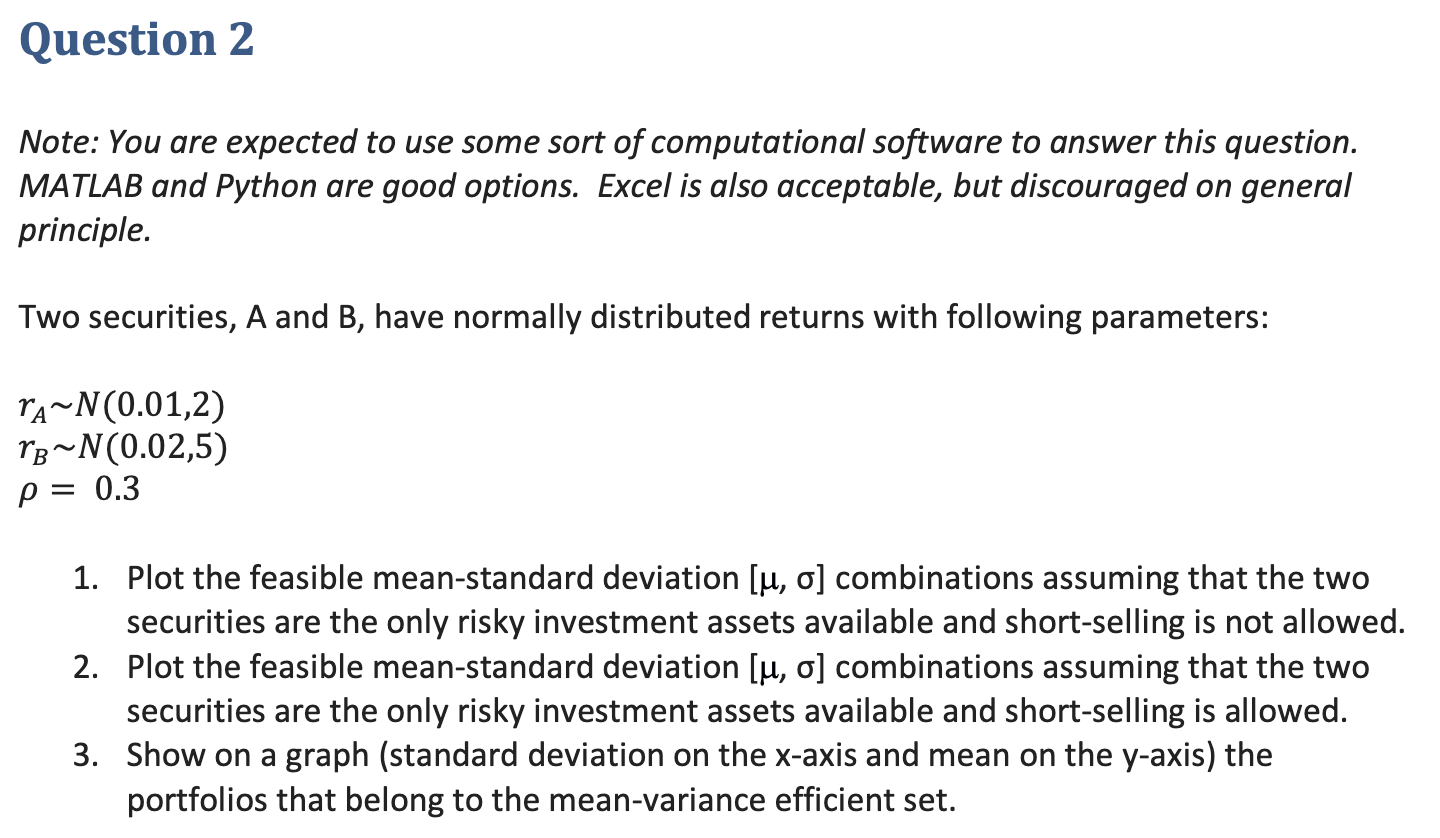
Question 2 Note: You are expected to use some sort of computational software to answer this question. MATLAB and Python are good options. Excel is also acceptable, but discouraged on general principle. Two securities, A and B, have normally distributed returns with following parameters: TA-N(0.01,2) rg-N(0.02,5) p = 0.3 = 1. Plot the feasible mean-standard deviation [u, o] combinations assuming that the two securities are the only risky investment assets available and short-selling is not allowed. 2. Plot the feasible mean-standard deviation [u, o] combinations assuming that the two securities are the only risky investment assets available and short-selling is allowed. 3. Show on a graph (standard deviation on the x-axis and mean on the y-axis) the portfolios that belong to the mean-variance efficient set. Question 2 Note: You are expected to use some sort of computational software to answer this question. MATLAB and Python are good options. Excel is also acceptable, but discouraged on general principle. Two securities, A and B, have normally distributed returns with following parameters: TA-N(0.01,2) rg-N(0.02,5) p = 0.3 = 1. Plot the feasible mean-standard deviation [u, o] combinations assuming that the two securities are the only risky investment assets available and short-selling is not allowed. 2. Plot the feasible mean-standard deviation [u, o] combinations assuming that the two securities are the only risky investment assets available and short-selling is allowed. 3. Show on a graph (standard deviation on the x-axis and mean on the y-axis) the portfolios that belong to the mean-variance efficient set
Step by Step Solution
There are 3 Steps involved in it

Get step-by-step solutions from verified subject matter experts