

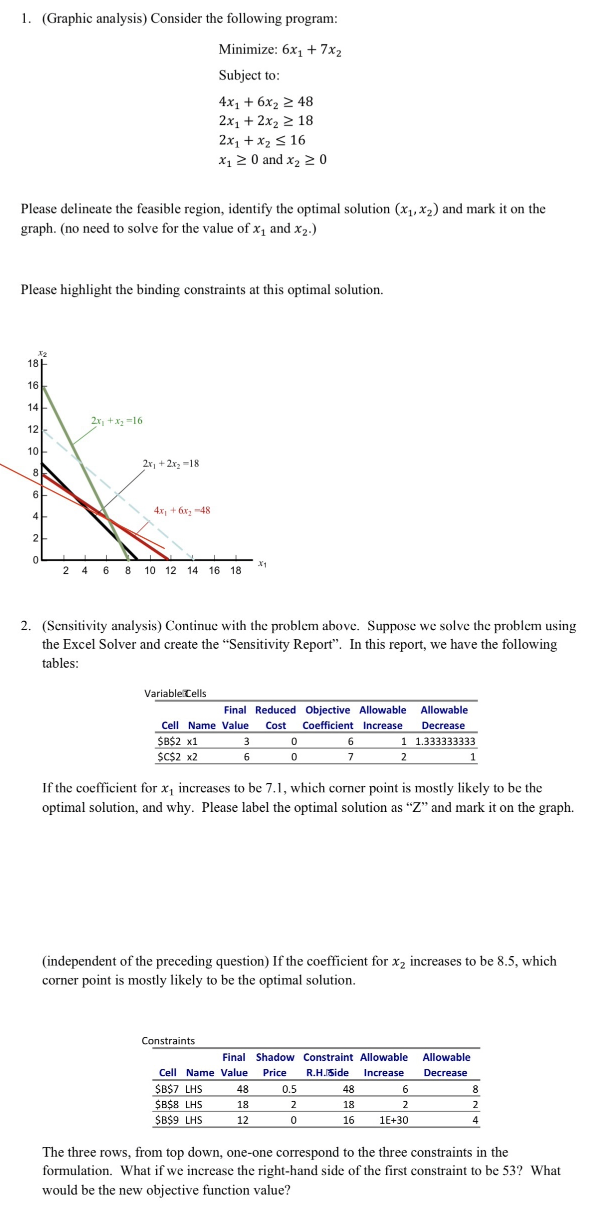
Question: * * Question 2 only * * ( Graphic analysis ) Consider the following program: Minimize: 6 x 1 + 7 x 2 Subject to:
Question onlyGraphic analysis Consider the following program:
Minimize:
Subject to:
and
Please delineate the feasible region, identify the optimal solution and mark it on the
graph. no need to solve for the value of and
Please highlight the binding constraints at this optimal solution.Graphic analysis Consider the following program:
Minimize:
Subject :
and
Please delineate the feasible region, identify the optimal solution and mark it on the
graph. no need to solve for the value of and
Please highlight the binding constraints at this optimal solution.
Sensitivity analysis Continue with the problem above. Suppose we solve the problem using
the Excel Solver and create the "Sensitivity Report". In this report, we have the following
tables:
If the coefficient for increases to be which corner point is mostly likely to be the
optimal solution, and why. Please label the optimal solution as and mark it on the graph.
independent of the preceding question If the coefficient for increases to be which
corner point is mostly likely to be the optimal solution.
Constraints
The three rows, from top down, oneone correspond to the three constraints in the
formulation. What if we increase the righthand side of the first constraint to be What
would be the new objective function value?
Step by Step Solution
There are 3 Steps involved in it
1 Expert Approved Answer
Step: 1 Unlock

Question Has Been Solved by an Expert!
Get step-by-step solutions from verified subject matter experts
Step: 2 Unlock
Step: 3 Unlock