

Question: Question# 2. Please answer all and complete the diagram. Expand Sidebar MIND Problems: Chapter 11 X to Assignment tempts Average / 1 Individual Problems 11-2
Question# 2. Please answer all and complete the diagram.
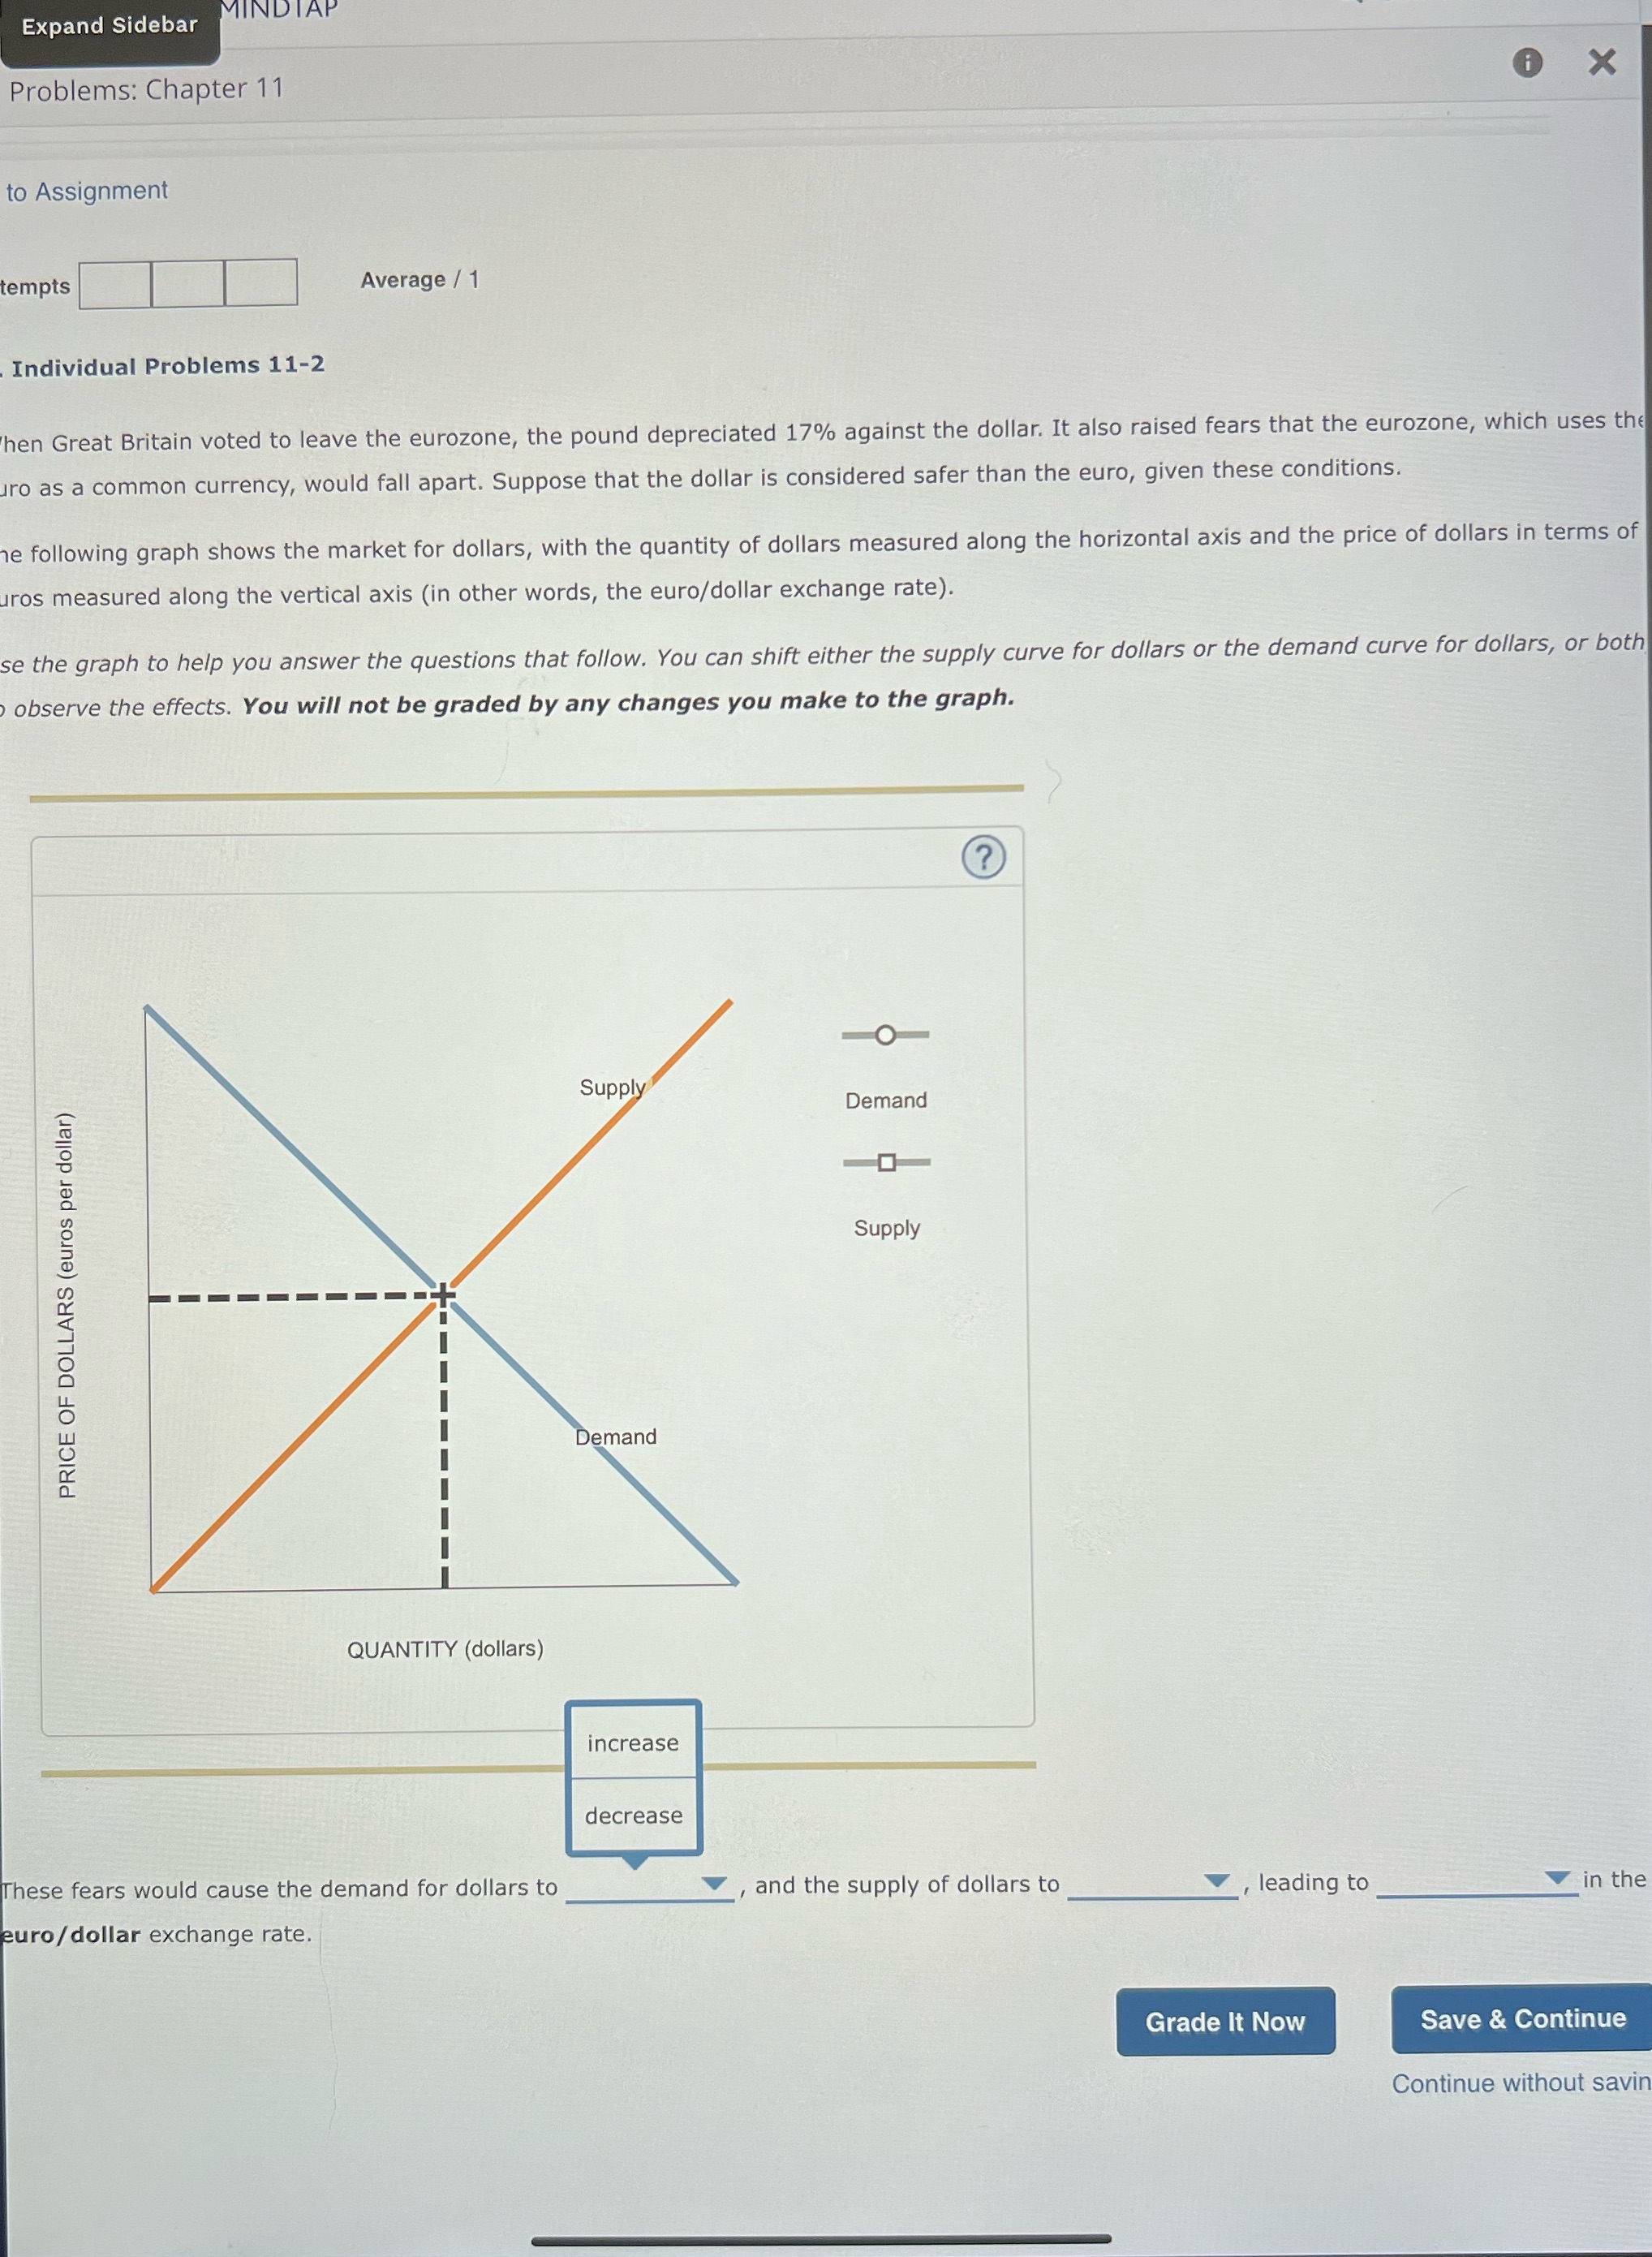
Expand Sidebar MIND Problems: Chapter 11 X to Assignment tempts Average / 1 Individual Problems 11-2 hen Great Britain voted to leave the eurozone, the pound depreciated 17% against the dollar. It also raised fears that the eurozone, which uses the uro as a common currency, would fall apart. Suppose that the dollar is considered safer than the euro, given these conditions. e following graph shows the market for dollars, with the quantity of dollars measured along the horizontal axis and the price of dollars in terms of uros measured along the vertical axis (in other words, the euro/dollar exchange rate). se the graph to help you answer the questions that follow. You can shift either the supply curve for dollars or the demand curve for dollars, or both observe the effects. You will not be graded by any changes you make to the graph. ? Supply Demand Supply PRICE OF DOLLARS (euros per dollar) Demand QUANTITY (dollars) increase decrease These fears would cause the demand for dollars to , and the supply of dollars to , leading to in the euro / dollar exchange rate. Grade It Now Save & Continue Continue without savin
Step by Step Solution
There are 3 Steps involved in it

Get step-by-step solutions from verified subject matter experts