

Question: Question 2. Please do work on a separate paper so I can fully understand #2 The following data represent the temperature T (Fahrenheit) in Kansas

Question 2. Please do work on a separate paper so I can fully understand
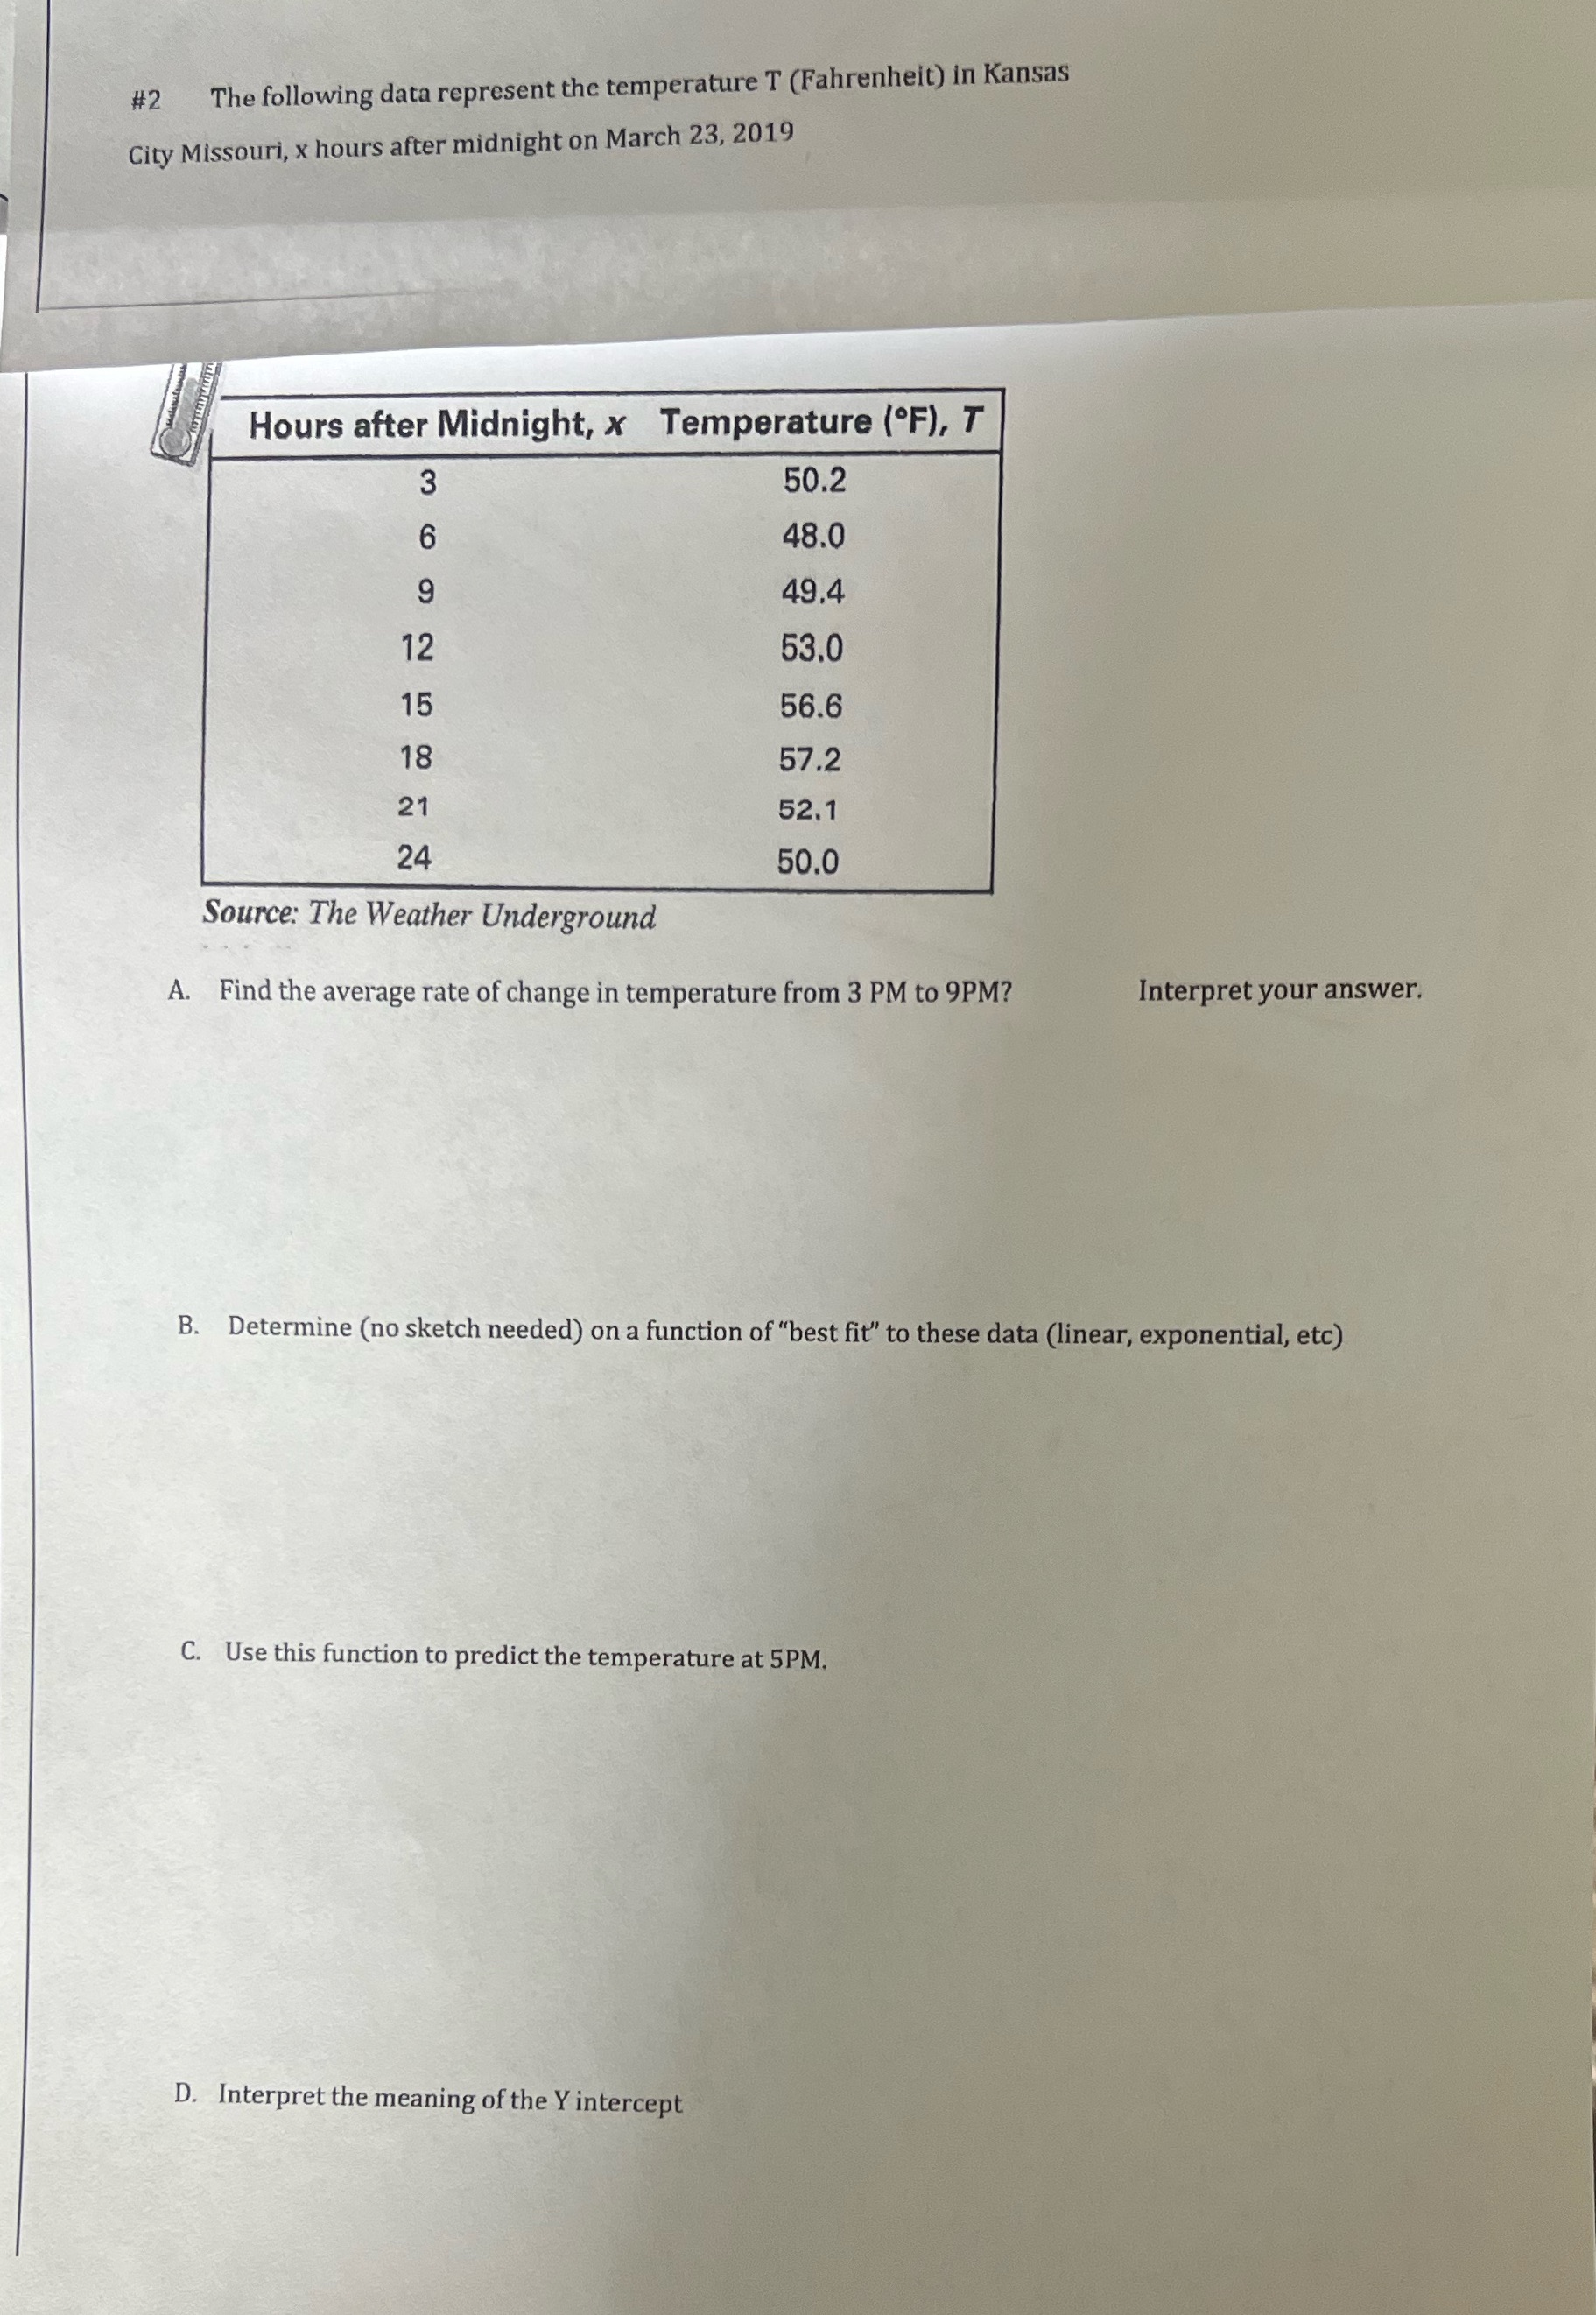
#2 The following data represent the temperature T (Fahrenheit) in Kansas City Missouri, x hours after midnight on March 23, 2019 Hours after Midnight, x Temperature (OF), T 50.2 48.0 49.4 12 53.0 15 56.6 18 57.2 21 52.1 24 50.0 Source: The Weather Underground A. Find the average rate of change in temperature from 3 PM to 9PM? Interpret your answer. B. Determine (no sketch needed) on a function of "best fit" to these data (linear, exponential, etc) C. Use this function to predict the temperature at 5PM. D. Interpret the meaning of the Y intercept
Step by Step Solution
There are 3 Steps involved in it
1 Expert Approved Answer
Step: 1 Unlock

Question Has Been Solved by an Expert!
Get step-by-step solutions from verified subject matter experts
Step: 2 Unlock
Step: 3 Unlock