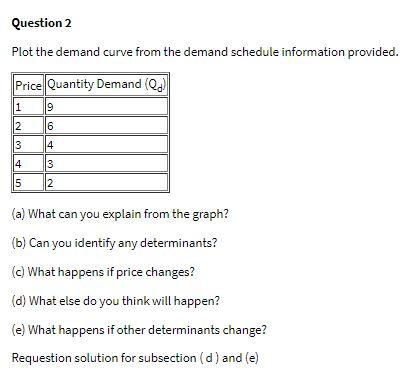
Question: Question 2 Plot the demand curve from the demand schedule information provided. Price Quantity Demand (d) 1 1 19 N 6 4 3 4 |

Question 2 Plot the demand curve from the demand

Question 2 Plot the demand curve from the demand schedule information provided. Price Quantity Demand (d) 1 1 19 N 6 4 3 4 | 3 5 2 (a) What can you explain from the graph? (b) Can you identify any determinants? (c) What happens if price changes? (d) What else do you think will happen? (e) What happens if other determinants change? Requestion solution for subsection (d) and (e)

Step by Step Solution

There are 3 Steps involved in it

1 Expert Approved Answer
Step: 1 Unlock blur-text-image
Question Has Been Solved by an Expert!

Get step-by-step solutions from verified subject matter experts

Step: 2 Unlock
Step: 3 Unlock

Students Have Also Explored These Related General Management Questions!