

Question: Question 2 Practice with Data and Kernel SVNs (i) Following previous examples in the textbook create a training and test set from the sets X,y
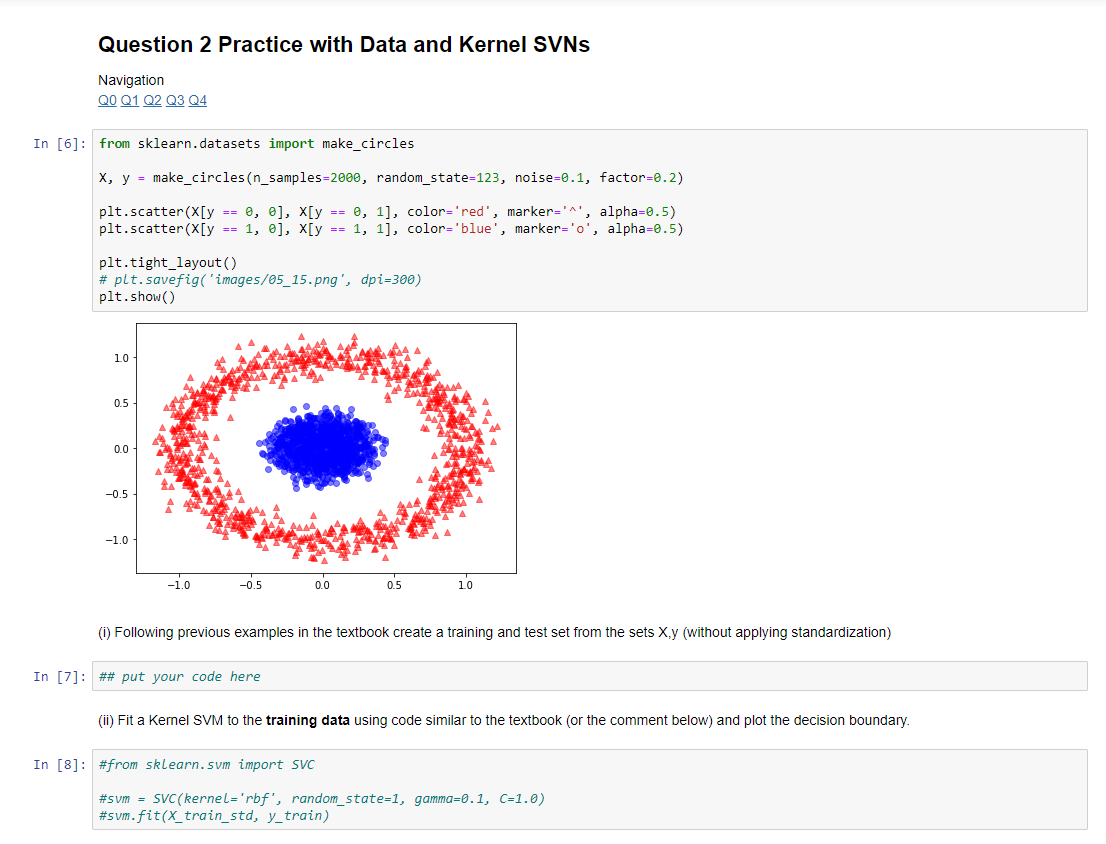
Question 2 Practice with Data and Kernel SVNs
(i) Following previous examples in the textbook create a training and test set from the sets X,y (without applying standardization)
(ii) Fit a Kernel SVM to the training data using code similar to the textbook (or the comment below) and plot the decision boundary.
#from sklearn.svm import SVC
#svm = SVC(kernel='rbf', random_state=1, gamma=0.1, C=1.0) #svm.fit(X_train_std, y_train)
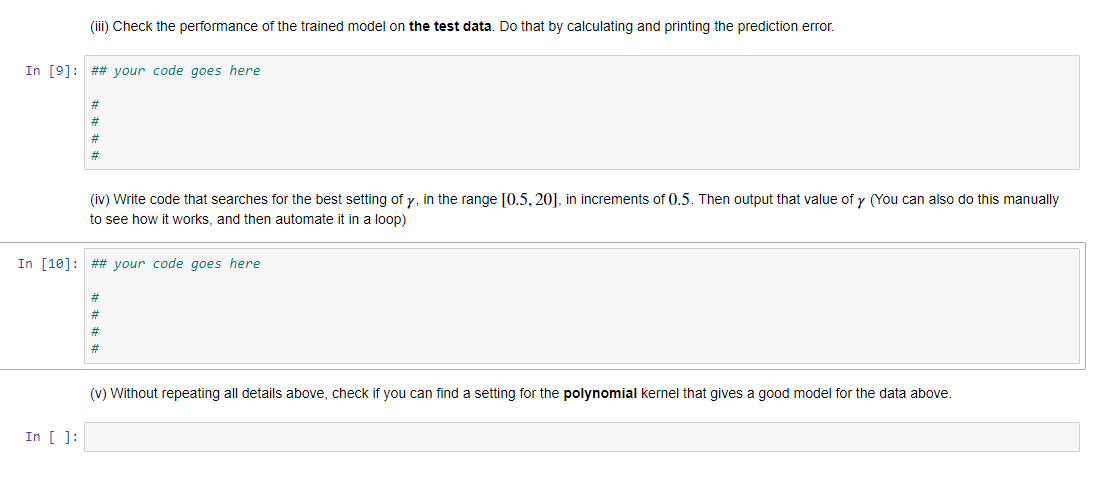
(iii) Check the performance of the trained model on the test data. Do that by calculating and printing the prediction error.
(iv) Write code that searches for the best setting of , in the range [0.5,20][0.5,20], in increments of 0.50.5. Then output that value of (You can also do this manually to see how it works, and then automate it in a loop)
(v) Without repeating all details above, check if you can find a setting for the polynomial kernel that gives a good model for the data above.
All Python code is below, please read.
# Python Code:
# Import all necessary python packages import numpy as np import os import pandas as pd import matplotlib.pyplot as plt from matplotlib.colors import ListedColormap from sklearn.linear_model import LogisticRegression
from IPython.display import Image from IPython.display import Math from IPython.display import Latex
# ### Reading-in the Iris data
s = os.path.join('https://archive.ics.uci.edu', 'ml', 'machine-learning-databases', 'iris','iris.data') s = s.replace("\\","/"); print('URL:', s) df = pd.read_csv(s,header=None,encoding='utf-8')
# select setosa and versicolor y = df.iloc[0:100, 4].values y = np.where(y == 'Iris-setosa', -1, 1)
# extract sepal length and petal length X = df.iloc[:100, [0, 2]].values
# plot data plt.scatter(X[:50, 0], X[:50, 1], color='red', marker='o', label='setosa') plt.scatter(X[50:100, 0], X[50:100, 1], color='blue', marker='x', label='versicolor')
plt.xlabel('sepal length [cm]') plt.ylabel('petal length [cm]') plt.legend(loc='upper left')
# plt.savefig('images/02_06.png', dpi=300) plt.show()
import numpy as np
class Perceptron(object): """Perceptron classifier.
Parameters ------------ eta : float Learning rate (between 0.0 and 1.0) n_iter : int Passes over the training dataset. random_state : int Random number generator seed for random weight initialization.
Attributes ----------- w_ : 1d-array Weights after fitting. errors_ : list Number of misclassifications (updates) in each epoch.
""" def __init__(self, eta=0.01, n_iter=50, random_state=1): self.eta = eta self.n_iter = n_iter self.random_state = random_state
def fit(self, X, y): """Fit training data.
Parameters ---------- X : {array-like}, shape = [n_examples, n_features] Training vectors, where n_examples is the number of examples and n_features is the number of features. y : array-like, shape = [n_examples] Target values.
Returns ------- self : object
""" rgen = np.random.RandomState(self.random_state) self.w_ = rgen.normal(loc=0.0, scale=0.01, size=1 + X.shape[1]) self.errors_ = []
for _ in range(self.n_iter): errors = 0 for xi, target in zip(X, y): update = self.eta * (target - self.predict(xi)) self.w_[1:] += update * xi self.w_[0] += update errors += int(update != 0.0) self.errors_.append(errors) # my do-nothing code IK = 2020 # my do-nothing code return self
def net_input(self, X): """Calculate net input""" return np.dot(X, self.w_[1:]) + self.w_[0]
def predict(self, X): """Return class label after unit step""" return np.where(self.net_input(X) >= 0.0, 1, -1)
Question 2 Practice with Data and Kernel SVNS Navigation QO Q1 Q2 Q3 Q4 In [6]: from sklearn.datasets import make_circles X, y = make_circles (n_samples=2000, random_state=123, noise=0.1, factor=0.2) plt.scatter(X[y == 0, 0], X[y == 0, 1], color='red', marker='^', alpha=0.5) plt.scatter(X[y == 1, 0], X[y == 1, 1], color='blue', marker='o', alpha=0.5) plt.tight_layout() # plt. savefig('images/05_15.png', dpi=300) plt.show() -1.0 -0.5 0.0 05 20 (1) Following previous examples in the textbook create a training and test set from the sets X.y (without applying standardization) In [7]: ## put your code here (ii) Fit a Kernel SVM to the training data using code similar to the textbook (or the comment below) and plot the decision boundary. In [8]: #from sklearn.sum import SVC #sum - SVC(Kernel='rbf', random_state=1, gamma=0.1, C=1.0) #sum.fit(X_train_std, y_train) (iii) Check the performance of the trained model on the test data. Do that by calculating and printing the prediction error. In [9]: ## your code goes here # # # # (iv) Write code that searches for the best setting of y, in the range [0.5, 20), in increments of 0.5. Then output that value of y (You can also do this manually to see how it works, and then automate it in a loop) In [10]: ## your code goes here # # # # (v) Without repeating all details above, check if you can find a setting for the polynomial kernel that gives a good model for the data above. In [ ]: Question 2 Practice with Data and Kernel SVNS Navigation QO Q1 Q2 Q3 Q4 In [6]: from sklearn.datasets import make_circles X, y = make_circles (n_samples=2000, random_state=123, noise=0.1, factor=0.2) plt.scatter(X[y == 0, 0], X[y == 0, 1], color='red', marker='^', alpha=0.5) plt.scatter(X[y == 1, 0], X[y == 1, 1], color='blue', marker='o', alpha=0.5) plt.tight_layout() # plt. savefig('images/05_15.png', dpi=300) plt.show() -1.0 -0.5 0.0 05 20 (1) Following previous examples in the textbook create a training and test set from the sets X.y (without applying standardization) In [7]: ## put your code here (ii) Fit a Kernel SVM to the training data using code similar to the textbook (or the comment below) and plot the decision boundary. In [8]: #from sklearn.sum import SVC #sum - SVC(Kernel='rbf', random_state=1, gamma=0.1, C=1.0) #sum.fit(X_train_std, y_train) (iii) Check the performance of the trained model on the test data. Do that by calculating and printing the prediction error. In [9]: ## your code goes here # # # # (iv) Write code that searches for the best setting of y, in the range [0.5, 20), in increments of 0.5. Then output that value of y (You can also do this manually to see how it works, and then automate it in a loop) In [10]: ## your code goes here # # # # (v) Without repeating all details above, check if you can find a setting for the polynomial kernel that gives a good model for the data above. In [ ]
Step by Step Solution
There are 3 Steps involved in it

Get step-by-step solutions from verified subject matter experts