

Question: Question 2: Project Analysis and Visual Representation In any project, there is a need to develop analytics on project progress to ensure it stays within
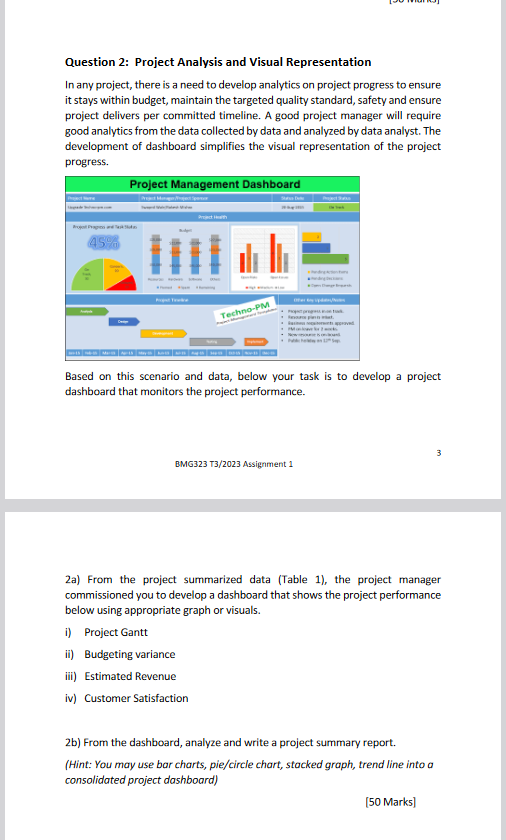
Question 2: Project Analysis and Visual Representation In any project, there is a need to develop analytics on project progress to ensure it stays within budget, maintain the targeted quality standard, safety and ensure project delivers per committed timeline. A good project manager will require good analytics from the data collected by data and analyzed by data analyst. The development of dashboard simplifies the visual representation of the project progress. Based on this scenario and data, below your task is to develop a project dashboard that monitors the project performance. 3 BMG323 T3/2023 Assignment 1 2a) From the project summarized data (Table 1), the project manager commissioned you to develop a dashboard that shows the project performance below using appropriate graph or visuals. i) Project Gantt ii) Budgeting variance iii) Estimated Revenue iv) Customer Satisfaction 2b) From the dashboard, analyze and write a project summary report. (Hint: You may use bar charts, pie/circle chart, stacked graph, trend line into a consolidated project dashboard) [50 Marks]
Step by Step Solution
There are 3 Steps involved in it

Get step-by-step solutions from verified subject matter experts