

# Question 2 Simple linear model. # CG Q2a # Build a linear regression model that...
Fantastic news! We've Found the answer you've been seeking!
Question:
Transcribed Image Text:
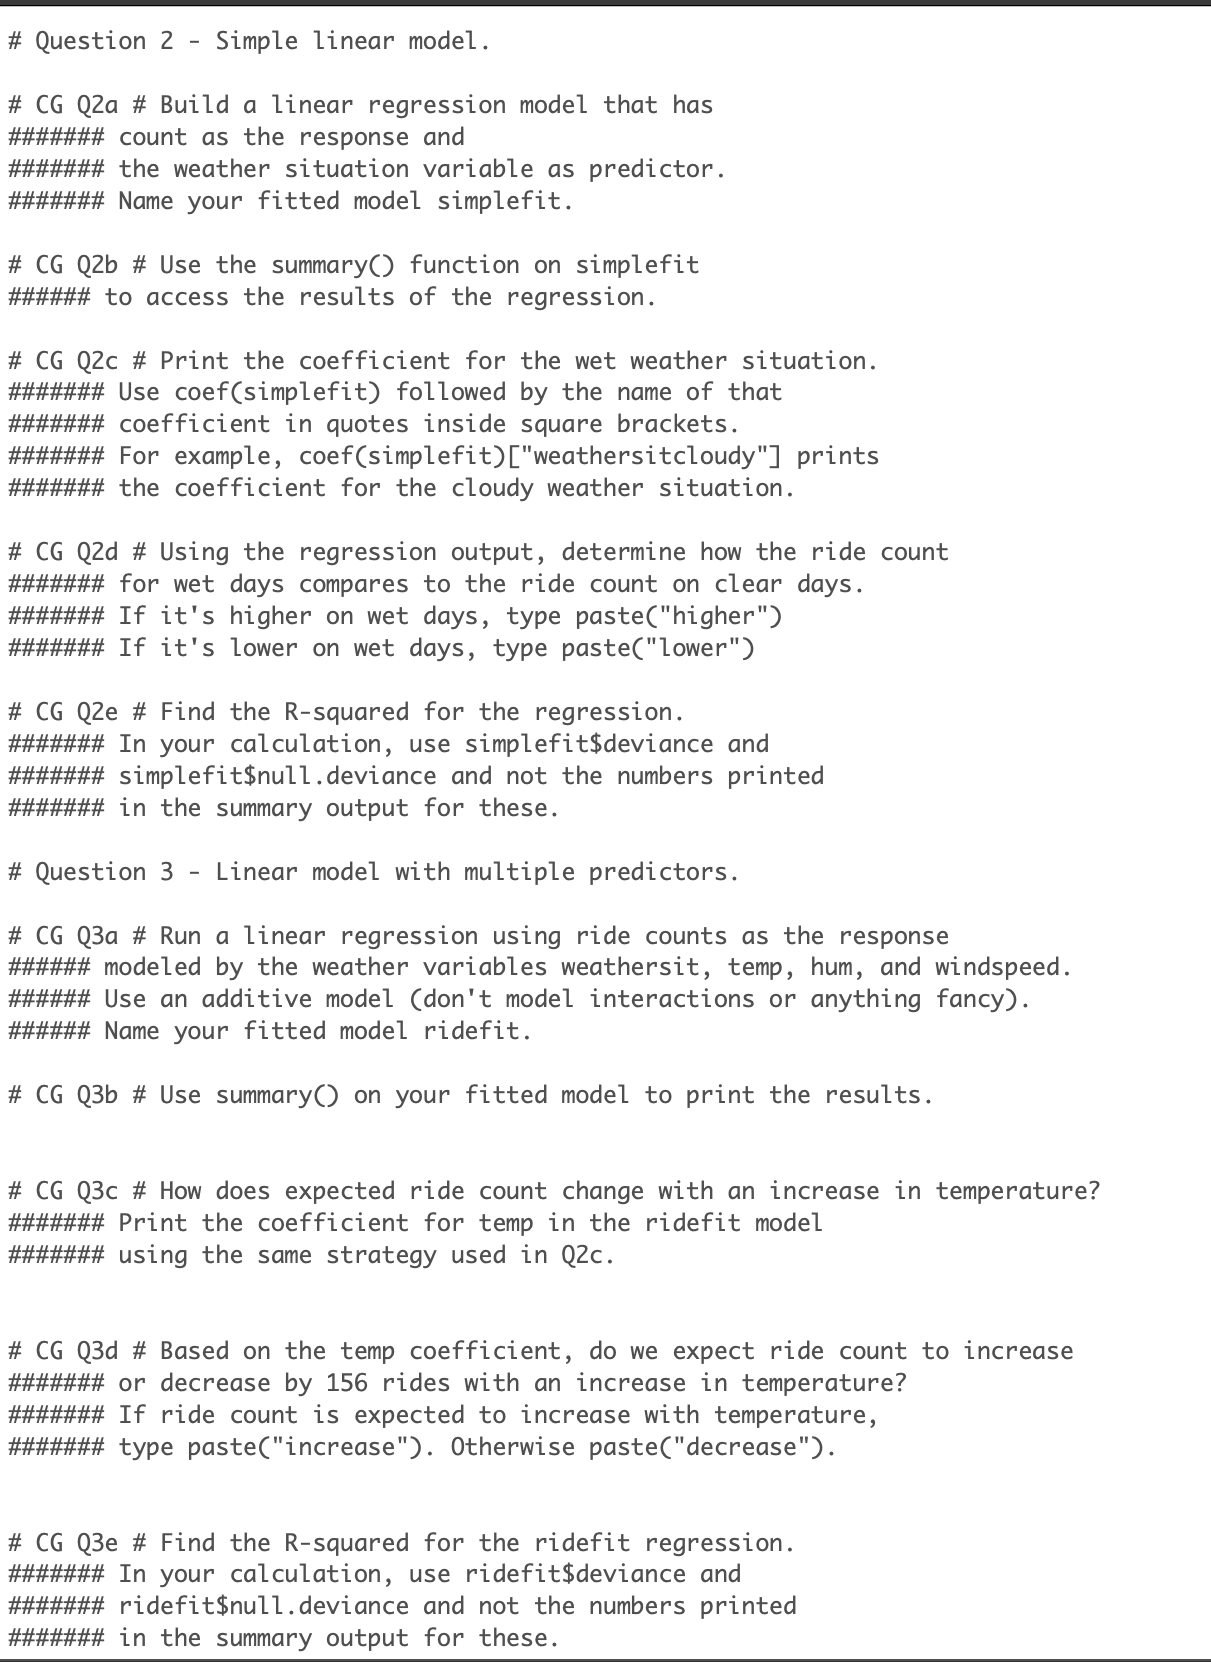
# Question 2 Simple linear model. # CG Q2a # Build a linear regression model that has ####### count as the response and ####### the weather situation variable as predictor. ####### Name your fitted model simplefit. # CG Q2b # Use the summary() function on simplefit ###### to access the results of the regression. # CG Q2c # Print the coefficient for the wet weather situation. ####### Use coef(simplefit) followed by the name of that ####### coefficient in quotes inside square brackets. ####### For example, coef(simplefit) ["weathersitcloudy"] prints ####### the coefficient for the cloudy weather situation. # CG Q2d # Using the regression output, determine how the ride count ####### for wet days compares to the ride count on clear days. ####### If it's higher on wet days, type paste("higher") ####### If it's lower on wet days, type paste("lower") # CG Q2e # Find the R-squared for the regression. ####### In your calculation, use simplefit$deviance and ####### simplefit$null.deviance and not the numbers printed ####### in the summary output for these. # Question 3 - Linear model with multiple predictors. # CG Q3a # Run a linear regression using ride counts as the response ###### modeled by the weather variables weathersit, temp, hum, and windspeed. ###### Use an additive model (don't model interactions or anything fancy). ###### Name your fitted model ridefit. # CG Q3b # Use summary() on your fitted model to print the results. # CG Q3c # How does expected ride count change with an increase in temperature? ####### Print the coefficient for temp in the ridefit model ####### using the same strategy used in Q2c. # CG Q3d # Based on the temp coefficient, do we expect ride count to increase ####### or decrease by 156 rides with an increase in temperature? ####### If ride count is expected to increase with temperature, ####### type paste("increase"). Otherwise paste("decrease"). # CG Q3e # Find the R-squared for the ridefit regression. ####### In your calculation, use ridefit$deviance and ####### ridefit$null.deviance and not the numbers printed ####### in the summary output for these. # Question 2 Simple linear model. # CG Q2a # Build a linear regression model that has ####### count as the response and ####### the weather situation variable as predictor. ####### Name your fitted model simplefit. # CG Q2b # Use the summary() function on simplefit ###### to access the results of the regression. # CG Q2c # Print the coefficient for the wet weather situation. ####### Use coef(simplefit) followed by the name of that ####### coefficient in quotes inside square brackets. ####### For example, coef(simplefit) ["weathersitcloudy"] prints ####### the coefficient for the cloudy weather situation. # CG Q2d # Using the regression output, determine how the ride count ####### for wet days compares to the ride count on clear days. ####### If it's higher on wet days, type paste("higher") ####### If it's lower on wet days, type paste("lower") # CG Q2e # Find the R-squared for the regression. ####### In your calculation, use simplefit$deviance and ####### simplefit$null.deviance and not the numbers printed ####### in the summary output for these. # Question 3 - Linear model with multiple predictors. # CG Q3a # Run a linear regression using ride counts as the response ###### modeled by the weather variables weathersit, temp, hum, and windspeed. ###### Use an additive model (don't model interactions or anything fancy). ###### Name your fitted model ridefit. # CG Q3b # Use summary() on your fitted model to print the results. # CG Q3c # How does expected ride count change with an increase in temperature? ####### Print the coefficient for temp in the ridefit model ####### using the same strategy used in Q2c. # CG Q3d # Based on the temp coefficient, do we expect ride count to increase ####### or decrease by 156 rides with an increase in temperature? ####### If ride count is expected to increase with temperature, ####### type paste("increase"). Otherwise paste("decrease"). # CG Q3e # Find the R-squared for the ridefit regression. ####### In your calculation, use ridefit$deviance and ####### ridefit$null.deviance and not the numbers printed ####### in the summary output for these. # Question 2 Simple linear model. # CG Q2a # Build a linear regression model that has ####### count as the response and ####### the weather situation variable as predictor. ####### Name your fitted model simplefit. # CG Q2b # Use the summary() function on simplefit ###### to access the results of the regression. # CG Q2c # Print the coefficient for the wet weather situation. ####### Use coef(simplefit) followed by the name of that ####### coefficient in quotes inside square brackets. ####### For example, coef(simplefit) ["weathersitcloudy"] prints ####### the coefficient for the cloudy weather situation. # CG Q2d # Using the regression output, determine how the ride count ####### for wet days compares to the ride count on clear days. ####### If it's higher on wet days, type paste("higher") ####### If it's lower on wet days, type paste("lower") # CG Q2e # Find the R-squared for the regression. ####### In your calculation, use simplefit$deviance and ####### simplefit$null.deviance and not the numbers printed ####### in the summary output for these. # Question 3 - Linear model with multiple predictors. # CG Q3a # Run a linear regression using ride counts as the response ###### modeled by the weather variables weathersit, temp, hum, and windspeed. ###### Use an additive model (don't model interactions or anything fancy). ###### Name your fitted model ridefit. # CG Q3b # Use summary() on your fitted model to print the results. # CG Q3c # How does expected ride count change with an increase in temperature? ####### Print the coefficient for temp in the ridefit model ####### using the same strategy used in Q2c. # CG Q3d # Based on the temp coefficient, do we expect ride count to increase ####### or decrease by 156 rides with an increase in temperature? ####### If ride count is expected to increase with temperature, ####### type paste("increase"). Otherwise paste("decrease"). # CG Q3e # Find the R-squared for the ridefit regression. ####### In your calculation, use ridefit$deviance and ####### ridefit$null.deviance and not the numbers printed ####### in the summary output for these. # Question 2 Simple linear model. # CG Q2a # Build a linear regression model that has ####### count as the response and ####### the weather situation variable as predictor. ####### Name your fitted model simplefit. # CG Q2b # Use the summary() function on simplefit ###### to access the results of the regression. # CG Q2c # Print the coefficient for the wet weather situation. ####### Use coef(simplefit) followed by the name of that ####### coefficient in quotes inside square brackets. ####### For example, coef(simplefit) ["weathersitcloudy"] prints ####### the coefficient for the cloudy weather situation. # CG Q2d # Using the regression output, determine how the ride count ####### for wet days compares to the ride count on clear days. ####### If it's higher on wet days, type paste("higher") ####### If it's lower on wet days, type paste("lower") # CG Q2e # Find the R-squared for the regression. ####### In your calculation, use simplefit$deviance and ####### simplefit$null.deviance and not the numbers printed ####### in the summary output for these. # Question 3 - Linear model with multiple predictors. # CG Q3a # Run a linear regression using ride counts as the response ###### modeled by the weather variables weathersit, temp, hum, and windspeed. ###### Use an additive model (don't model interactions or anything fancy). ###### Name your fitted model ridefit. # CG Q3b # Use summary() on your fitted model to print the results. # CG Q3c # How does expected ride count change with an increase in temperature? ####### Print the coefficient for temp in the ridefit model ####### using the same strategy used in Q2c. # CG Q3d # Based on the temp coefficient, do we expect ride count to increase ####### or decrease by 156 rides with an increase in temperature? ####### If ride count is expected to increase with temperature, ####### type paste("increase"). Otherwise paste("decrease"). # CG Q3e # Find the R-squared for the ridefit regression. ####### In your calculation, use ridefit$deviance and ####### ridefit$null.deviance and not the numbers printed ####### in the summary output for these. # Question 2 Simple linear model. # CG Q2a # Build a linear regression model that has ####### count as the response and ####### the weather situation variable as predictor. ####### Name your fitted model simplefit. # CG Q2b # Use the summary() function on simplefit ###### to access the results of the regression. # CG Q2c # Print the coefficient for the wet weather situation. ####### Use coef(simplefit) followed by the name of that ####### coefficient in quotes inside square brackets. ####### For example, coef(simplefit) ["weathersitcloudy"] prints ####### the coefficient for the cloudy weather situation. # CG Q2d # Using the regression output, determine how the ride count ####### for wet days compares to the ride count on clear days. ####### If it's higher on wet days, type paste("higher") ####### If it's lower on wet days, type paste("lower") # CG Q2e # Find the R-squared for the regression. ####### In your calculation, use simplefit$deviance and ####### simplefit$null.deviance and not the numbers printed ####### in the summary output for these. # Question 3 - Linear model with multiple predictors. # CG Q3a # Run a linear regression using ride counts as the response ###### modeled by the weather variables weathersit, temp, hum, and windspeed. ###### Use an additive model (don't model interactions or anything fancy). ###### Name your fitted model ridefit. # CG Q3b # Use summary() on your fitted model to print the results. # CG Q3c # How does expected ride count change with an increase in temperature? ####### Print the coefficient for temp in the ridefit model ####### using the same strategy used in Q2c. # CG Q3d # Based on the temp coefficient, do we expect ride count to increase ####### or decrease by 156 rides with an increase in temperature? ####### If ride count is expected to increase with temperature, ####### type paste("increase"). Otherwise paste("decrease"). # CG Q3e # Find the R-squared for the ridefit regression. ####### In your calculation, use ridefit$deviance and ####### ridefit$null.deviance and not the numbers printed ####### in the summary output for these. # Question 2 Simple linear model. # CG Q2a # Build a linear regression model that has ####### count as the response and ####### the weather situation variable as predictor. ####### Name your fitted model simplefit. # CG Q2b # Use the summary() function on simplefit ###### to access the results of the regression. # CG Q2c # Print the coefficient for the wet weather situation. ####### Use coef(simplefit) followed by the name of that ####### coefficient in quotes inside square brackets. ####### For example, coef(simplefit) ["weathersitcloudy"] prints ####### the coefficient for the cloudy weather situation. # CG Q2d # Using the regression output, determine how the ride count ####### for wet days compares to the ride count on clear days. ####### If it's higher on wet days, type paste("higher") ####### If it's lower on wet days, type paste("lower") # CG Q2e # Find the R-squared for the regression. ####### In your calculation, use simplefit$deviance and ####### simplefit$null.deviance and not the numbers printed ####### in the summary output for these. # Question 3 - Linear model with multiple predictors. # CG Q3a # Run a linear regression using ride counts as the response ###### modeled by the weather variables weathersit, temp, hum, and windspeed. ###### Use an additive model (don't model interactions or anything fancy). ###### Name your fitted model ridefit. # CG Q3b # Use summary() on your fitted model to print the results. # CG Q3c # How does expected ride count change with an increase in temperature? ####### Print the coefficient for temp in the ridefit model ####### using the same strategy used in Q2c. # CG Q3d # Based on the temp coefficient, do we expect ride count to increase ####### or decrease by 156 rides with an increase in temperature? ####### If ride count is expected to increase with temperature, ####### type paste("increase"). Otherwise paste("decrease"). # CG Q3e # Find the R-squared for the ridefit regression. ####### In your calculation, use ridefit$deviance and ####### ridefit$null.deviance and not the numbers printed ####### in the summary output for these.
Expert Answer:
Answer rating: 100% (QA)
Question 2 Simple linear model CG Q2a Build a linear regression model Python Code import pandas as pd from sklearnlinearmodel import LinearRegression Load the data data pdreadcsvridedatacsv Split the ... View the full answer

Related Book For 

Applied Regression Analysis and Other Multivariable Methods
ISBN: 978-1285051086
5th edition
Authors: David G. Kleinbaum, Lawrence L. Kupper, Azhar Nizam, Eli S. Rosenberg
Posted Date:
Students also viewed these programming questions
-
A 6 2 kg woman A sits atop the 7 6 kg cart B , both of which are initially at rest. It is given that \ theta = 2 6 \ deg and the woman slides down the incline of length L = 3 . 5 m . Ignore the mass...
-
The data table gives various characteristics of 318 types of cars sold in the United States during the 2011 model years. Use the combined mileage rating as the response and the horsepower of the...
-
In 1990, Business Week magazine compiled financial data on the 1,000 companies that had the biggest impact on the U.S. economy. Data from this compilation were presented in Problem 13 of Chapter 8....
-
The $1.6 Billion Mega-millions winning lottery ticket is based upon the total amount of cash received if the annuity option is taken. The cash prize is $913,700,000 which you get immediately. The...
-
The trapezoidal channel of Fig P10.17 is made of brickwork and slopes at 1:500. Determine the flow rate if the normal depth is 80 cm. 30 30 2 m
-
Find all invariant subspaces, cf. Exercise 7.4.32, of a rotation in R3. Exercise 7.4.32 The subspace W of a vector space V is said to be an invariant subspace under the linear transformation L: V V...
-
As a preliminary step in optimizing the coating process of iron oxide nanoparticles engineers explored the effects, of two factors each having two levels on the response \(y=\) increase in particle...
-
Electrical heating of a pipe (Fig. 10B.8), in the manufacture of glass-coated steel pipes, it is common practice first to heat the pipe to the melting range of glass and then to contact the hot pipe...
-
Why would it be a good idea to do international business or start an business in Canada? with supporting details related to and backing the point.
-
Easley-O?Hara Office Equipment sells furniture and technology solutions to consumers and to businesses. Most consumers pay for their purchases with credit cards and business customers make purchases...
-
3 Answer all questions in the spaces provided. Show 1. Write sec (1-sin0) as a monomial containing as single function in simplest form. 2. Prove each of the following identities: a csc 8 sin 9 cos2 =...
-
Consider the CAPM: Olmsted stock has a beta of 1.4 and is expected to return 18%. If the risk- free rate is 6%, what is the expected return on the S&P 500 (the Market Portfolio?
-
5. Carmen's credit card company charges her 21.90% interest per annum on her card. She started the month of July with a balance of $0.00. During the month of July, she made the following purchases:...
-
Our client, Mrs. Euphemia Welsher, has come to the firm with a problem. She is a resident of New York City, but spends two months of every year in Canada, as she owns a cottage outside Kingston....
-
On December 31, 2024, the end of the fiscal year, California Microtech Corporation held its semiconductor business for sale at year- end. The estimated fair value of the segment's assets, less costs...
-
Your mother wants to save $ 2 , 0 0 0 , 0 0 0 for retirement. She plans to invest annually in an account that pays 6 . 0 0 % over the next 2 0 years, and he wants 2 5 end - of - year withdrawals...
-
A young female presents with cyclical pain, dysmenorrheal and complain of infertility. Which of the following would be investigation of choice in her a) TVS b) Diagnostic laparoscopy c) Aspirate from...
-
What are bounds and what do companies do with them?
-
Five treatments for fever blisters, including a placebo, were randomly assigned to 30 patients. For each of the five treatments, the data in the accompanying table identify the number of days from...
-
Residential real estate prices are thought to depend, in part, on property size and number of bedrooms. The house size X1 (in hundreds of square feet), number of bedrooms X2, and house price Y (in...
-
The following set of questions relates to using Poisson regression methods to analyze data from an in vitro study of human chromosome damage. In this study, using Poisson regression is appropriate...
-
What is the concept behind constructing analysis pattern using analogy approach?
-
Analogy approach makes people end up building templates rather than building patterns. Explain.
-
Explain the concept behind constructing analysis pattern by using stability approach.

Study smarter with the SolutionInn App