

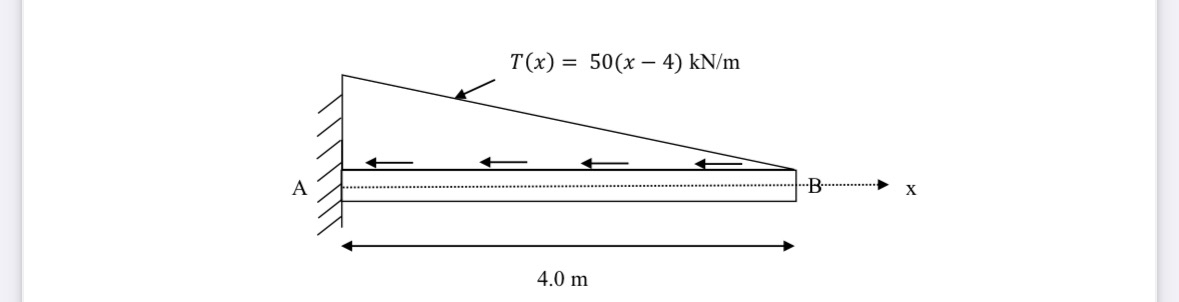
Question: Question # 2 : The bar shown in Figure 2 is subjected to a linearly distributed axial line loading that varies from zero at point
Question # :
The bar shown in Figure is subjected to a linearly distributed axial line loading that varies from
zero at point B to a maximum of at point A acting in the negative direction of x axis.
The bar has a constant crosssectional area and a modulus of elasticity
MPa.
Apply the finite element method hand calculations to plot the axial displacement and axial
stress along the length of the bar using:
a One element
b Two elements
c Four elements
Compare these plots with the exact solution. Develop two figures: i Comparison of the exact
solution and the finite element solution parts and c for axial displacement along the
length of the bar, ii Comparison of the exact solution and the finite element solution parts a
b and c for axial stress along the length of the bar.
Model the same problem using the commercial software SAP compare SAP results
to those obtained from and comment on the results.
Step by Step Solution
There are 3 Steps involved in it
1 Expert Approved Answer
Step: 1 Unlock

Question Has Been Solved by an Expert!
Get step-by-step solutions from verified subject matter experts
Step: 2 Unlock
Step: 3 Unlock