

Question: Question 2 The chart below shows average returns and betas with respect to US value weighted market portfolios for 10 portfolios of US stocks formed
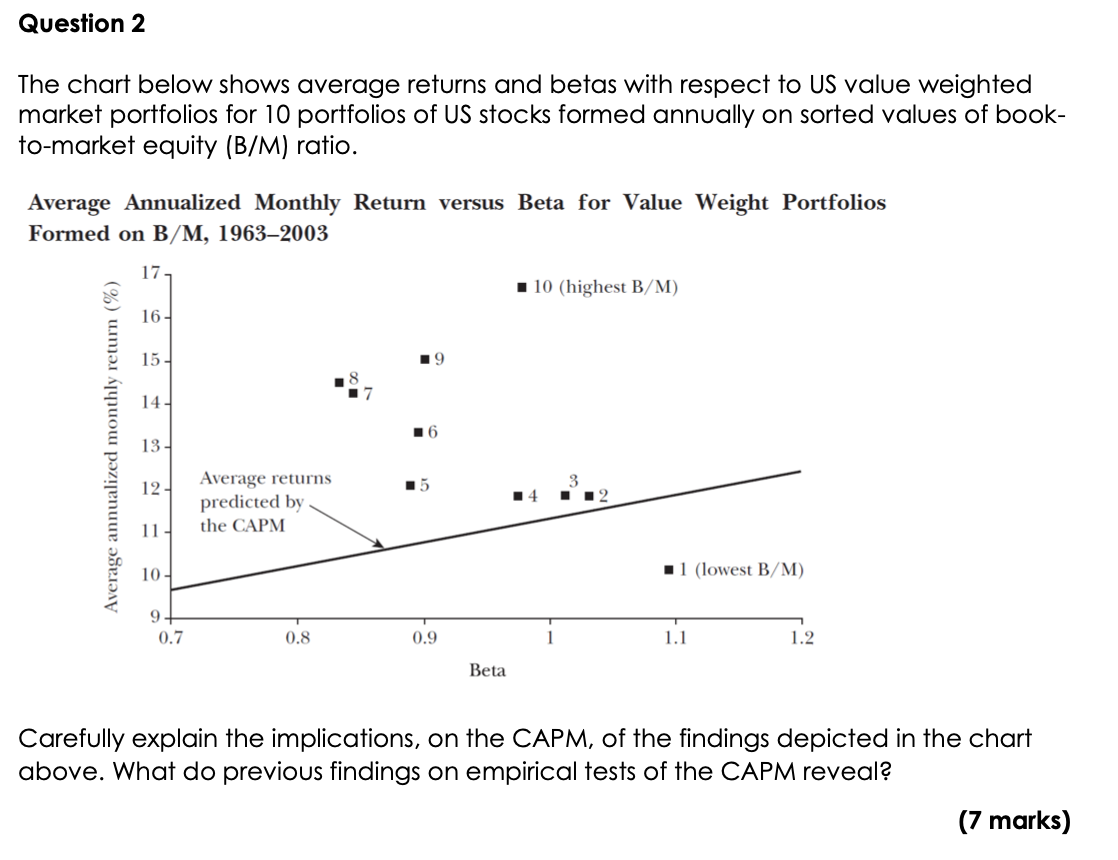
Question 2 The chart below shows average returns and betas with respect to US value weighted market portfolios for 10 portfolios of US stocks formed annually on sorted values of book- to-market equity (B/M) ratio. Average Annualized Monthly Return versus Beta for Value Weight Portfolios Formed on B/M, 19632003 17- 110 (highest B/M) 16- 15 19 14- 16 Average annualized monthly return (%) 13- 12-1 Average returns predicted by the CAPM 11- 10- 11 (lowest B/M) 9 0.7 0.8 0.9 1.1 1.2 Beta Carefully explain the implications, on the CAPM, of the findings depicted in the chart above. What do previous findings on empirical tests of the CAPM reveal? (7 marks)
Step by Step Solution
There are 3 Steps involved in it

Get step-by-step solutions from verified subject matter experts