

Question: Question 2 The comparative Balance Sheet and Income Statement for Whitbey Group Inc. are as follow: WHITBEY GROUP INC. Balance Sheet August 31, 2017 and
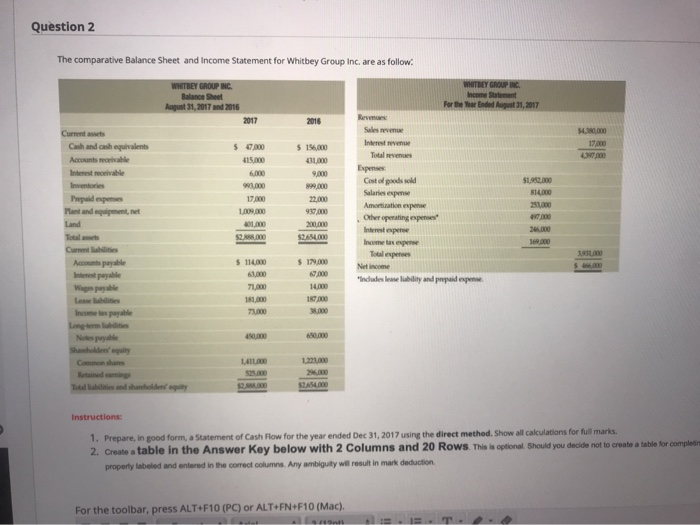
Question 2 The comparative Balance Sheet and Income Statement for Whitbey Group Inc. are as follow: WHITBEY GROUP INC. Balance Sheet August 31, 2017 and 2016 2017 2016 SO 17.000 $ 7.000 Current assets Cash and cash equivalents Accounts receivable Interest receivable $ 156,000 431,000 6.000 93.000 17.000 1.009.000 401.000 SA DO Prepaides Mantandement et Land WHITBEY GROUP INC Income Statement For the The Ended August 31, 2017 Revenues Sales en Interest Total revenues Expenses Cost of goods sold $132.000 Salami per 814.000 Amortization expense 251.00 Other operating experies Interpers 20.000 Incepere 16.000 Tuulepes Netice Indudes le ability and prepaid expense. 899,000 22.000 937.000 200.000 52.650.000 Accounts payable $ 114,000 100 71,00 181,000 73.000 $ 179,000 67.000 14.000 157,000 Wage pale Notes 0.000 1411 1221000 Instructions: 1. Prepare, in good form, a Statement Cash Flow for the year ended Dec 31, 2017 using the direct method. Show all calculations for full marks. 2. Create a table in the Answer Key below with 2 Columns and 20 Rows. This is optional. Should you decide not to create a table for completi property labeled and entered in the correct columns. Any ambiguity will result in mark deduction For the toolbar, press ALT+F10 (PC) or ALT+FN+F10 (Mac)
Step by Step Solution
There are 3 Steps involved in it

Get step-by-step solutions from verified subject matter experts