

Question: Question 2. The diagram below depicts a queue which has a maximum capacity of 4, an arrival rate A that increases when the queue is
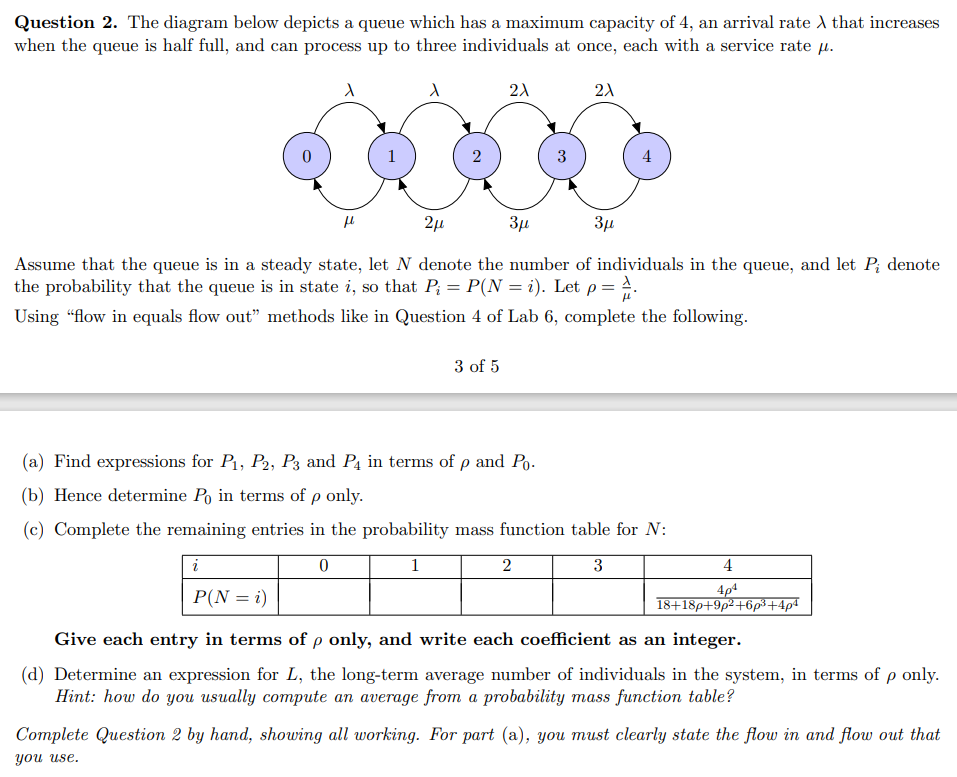
Question 2. The diagram below depicts a queue which has a maximum capacity of 4, an arrival rate A that increases when the queue is half full, and can process up to three individuals at once, each with a service rate p. A A 2 2A H 2u 34 3 Assume that the queue is in a steady state, let N denote the number of individuals in the queue, and let F; denote the probability that the queue is in state i, so that P, = P(N =i). Let p = Using \"flow in equals flow out\" methods like in Question 4 of Lab 6, complete the following,. 3ofs (a) Find expressions for Py, Ps, P; and P; in terms of p and F. (b) Hence determine F in terms of p only. (c) Complete the remaining entries in the probability mass function table for N: 4 4pd 18+ 18p+9p; +Gpi+dpd Give each entry in terms of p only, and write each coefficient as an integer. (d) Determine an expression for L, the long-term average number of individuals in the system, in terms of p only. Hint: how do you usually compute an average from a probability mass function table? Complete Question 2 by hand, showing all working. For part (a). you must clearly state the flow in and flow out that you use
Step by Step Solution
There are 3 Steps involved in it

Get step-by-step solutions from verified subject matter experts