

Question: The following data set represents the record high temperatures in degree Fahrenheit (F) for each of the 50 US states: 106 98 96 108
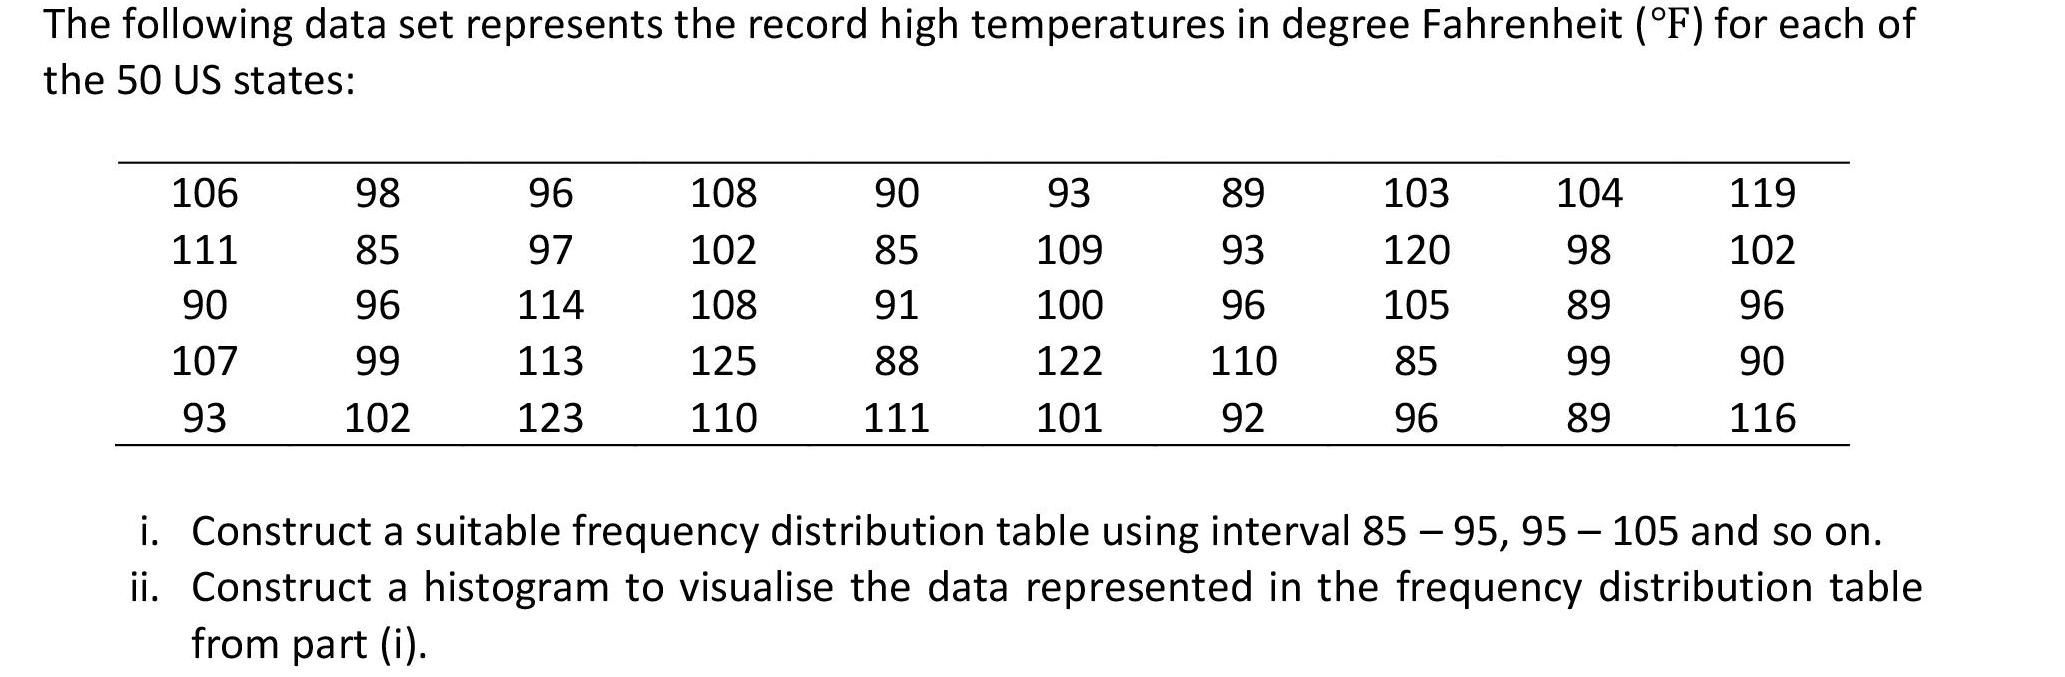
The following data set represents the record high temperatures in degree Fahrenheit (F) for each of the 50 US states: 106 98 96 108 90 93 89 103 104 119 111 85 97 102 85 109 93 120 98 102 90 96 114 108 91 100 96 105 89 96 107 99 113 125 88 122 110 85 99 90 93 102 123 110 111 101 92 96 89 116 i. Construct a suitable frequency distribution table using interval 85 95, 95 105 and so on. ii. Construct a histogram to visualise the data represented in the frequency distribution table from part (i).
Step by Step Solution
3.42 Rating (155 Votes )
There are 3 Steps involved in it
i Frequency distribution table Class i... View full answer

Get step-by-step solutions from verified subject matter experts