

Question: QUESTION 2 The following table describes a flow process chart for Fahim Intel Sdn Bhd . Flow Process Chart Activity: Processing expense reports Location: Account
QUESTION
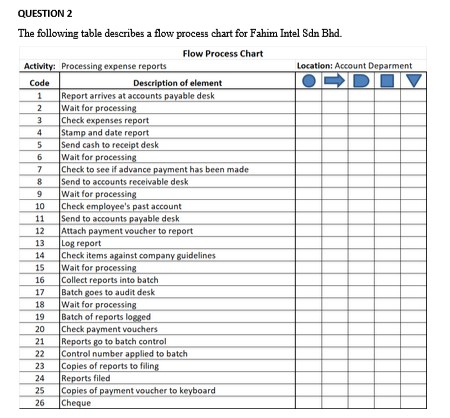
The following table describes a flow process chart for Fahim Intel Sdn Bhd
Flow Process Chart
Activity: Processing expense reports Location: Account Deparment Code Description of element Report arrives at accounts payable desk Wait for processing Check expenses report Stamp and date report Send cash to receipt desk Wait for processing Check to see if advance payment has been made Send to accounts receivable desk Wait for processing Check employee's past account Send to accounts payable desk Attach payment voucher to report Log report Check items against company guidelines Wait for processing Collect reports into batch Batch goes to audit desk Wait for processing Batch of reports logged Check payment vouchers Reports go to batch control Control number applied to batch Copies of reports to filing Reports filed Copies of payment voucher to keyboard Cheque
a Complete the flow process chart using the correct symbols. Copy the table WITHOUT the description column for the activities.
b Calculate the percentage of value added elements to complete the process of expense reports. Using the target of no more than nonvalueadded threshold, is the process considered as efficient?
Step by Step Solution
There are 3 Steps involved in it
1 Expert Approved Answer
Step: 1 Unlock

Question Has Been Solved by an Expert!
Get step-by-step solutions from verified subject matter experts
Step: 2 Unlock
Step: 3 Unlock