

Question: Question 2 The frequency distribution below summarises the petrol consumption of a model of car randomly chosen for a test. It shows the petrol consumption
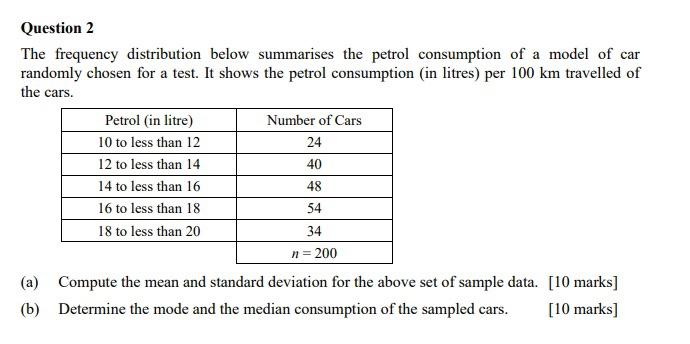
Question 2 The frequency distribution below summarises the petrol consumption of a model of car randomly chosen for a test. It shows the petrol consumption (in litres) per 100 km travelled of the cars. Petrol (in litre) Number of Cars 10 to less than 12 24 12 to less than 14 40 14 to less than 16 16 to less than 18 54 18 to less than 20 34 n=200 (a) Compute the mean and standard deviation for the above set of sample data. [10 marks] (b) Determine the mode and the median consumption of the sampled cars. [10 marks] 48
Step by Step Solution
There are 3 Steps involved in it
1 Expert Approved Answer
Step: 1 Unlock

Question Has Been Solved by an Expert!
Get step-by-step solutions from verified subject matter experts
Step: 2 Unlock
Step: 3 Unlock