

Question: Question 2 The JMP output below shows a CT analysis (Contingency Table) of the number of Years on First Job (YFJ) versus number of Years
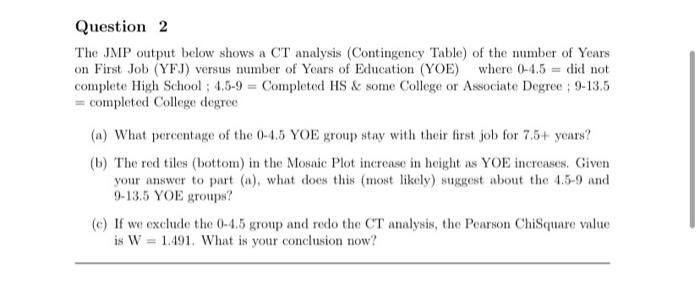
Question 2 The JMP output below shows a CT analysis (Contingency Table) of the number of Years on First Job (YFJ) versus number of Years of Education (YOE) where 0-4.5 = did not complete High School: 4.5-9 = Completed HS & some College or Associate Degree: 9-13.5 = completed College degree (a) What percentage of the 0-4.5 YOE group stay with their first job for 7.5+ years? (b) The red tiles (bottom) in the Mosaic Plot increase in height as YOE increases. Given your answer to part (n), what does this (most likely) suggest about the 4.5-9 and 9-13.5 YOE groups? (e) If we exclude the 0-4.5 group and redo the CT analysis, the Pearson ChiSquare value is W = 1.491. What is your conclusion now? CT of Years on First Job By Years of Education Mosaic Plot 1.00 7.5 0.75 5-7.5 Yearson First Job 0.50 2.5-5 0.25 0-2.5 0.001 0-45 450 0-13.5 Years of Education Freq: Kount Contingency Table Years on First Job Count 0-2.5 2.5-5 5-7,5 7.5+ Total Col 6 Row 0.4.5 5 15 22 28 70 8.93 16.67 41.51 60.87 7.14 21.43 31.43 40.00 4.5-9 21 35 16 10 82 37.50 38.89 30.19 21.74 25.61 42.68 19.51 12.20 9-13.5 30 40 15 8 93 53.57 44.44 28.30 17.39 32.26 43.01 16.13 8.60 Total 56 90 53 46 245 Tests N DF -LogLike RSquare (U) 245 6 23.164734 0.0700 Test ChiSquare Prob>Chisa Likelihood Ratio 46.329 <.0001 pearson c0001 years of education figure jmp output question the below shows a ct analysis table number on first job versus where did not complete high school: completed hs some college or associate degree: degree what percentage yoe group stay with their for red tiles in mosaic plot increase height as increases. given your answer to part does this likely suggest about and groups if we exclude redo chisquare value is w="1.491." conclusion now by yearson freq: kount contingency count total col row tests n df rsquare test prob>Chisa Likelihood Ratio 46.329 <.0001 pearson c0001 years of education figure jmp output question>
Step by Step Solution
There are 3 Steps involved in it

Get step-by-step solutions from verified subject matter experts