

Question: QUESTION 2 The SPSS output below shows investigation between amount of sodium (%) and BMI (kg/m2) taken from 15 randomly selected students in ABC Faculty.
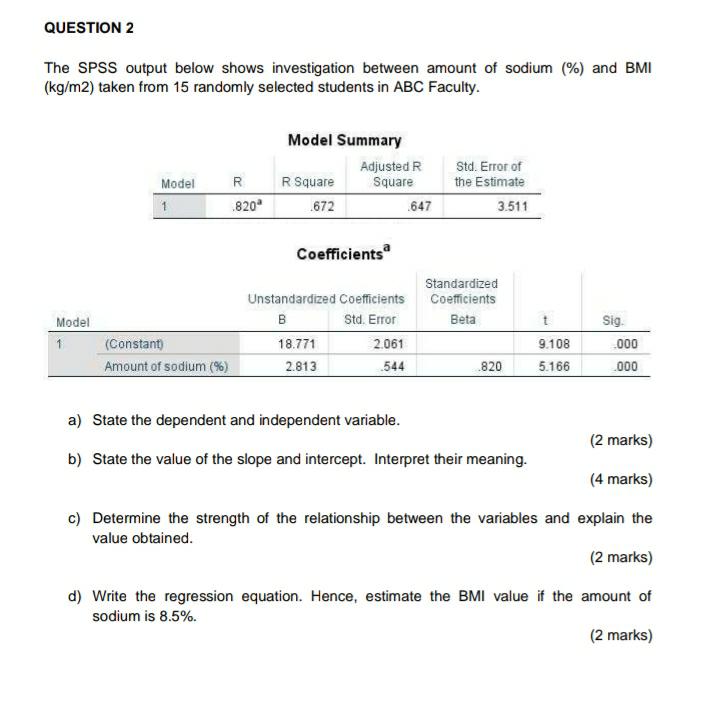
QUESTION 2 The SPSS output below shows investigation between amount of sodium (%) and BMI (kg/m2) taken from 15 randomly selected students in ABC Faculty. Model Summary Adjusted R Std. Error of Model R R Square Square the Estimate 1 820 672 647 3.511 Coefficients Standardized Unstandardized Coefficients Coefficients Model B Std. Error Beta Sig (Constant) 18.771 2.061 9.108 000 Amount of sodium (%) 2.813 544 820 5.166 000 a) State the dependent and independent variable. (2 marks) b) State the value of the slope and intercept. Interpret their meaning. (4 marks) c) Determine the strength of the relationship between the variables and explain the value obtained. (2 marks) d) Write the regression equation. Hence, estimate the BMI value if the amount of sodium is 8.5%. (2 marks)
Step by Step Solution
There are 3 Steps involved in it

Get step-by-step solutions from verified subject matter experts