

Question: Question 2 The Student Data Workbook file contains data collected from responses to questions, asked of a previous cohort who undertook this module some years
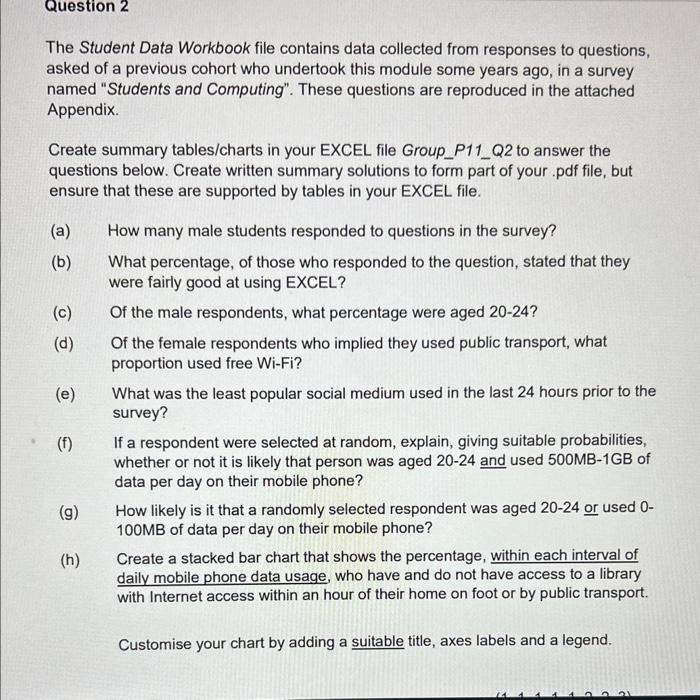
Question 2 The Student Data Workbook file contains data collected from responses to questions, asked of a previous cohort who undertook this module some years ago, in a survey named "Students and Computing". These questions are reproduced in the attached Appendix. Create summary tables/charts in your EXCEL file Group_P11_Q2 to answer the questions below. Create written summary solutions to form part of your .pdf file, but ensure that these are supported by tables in your EXCEL file. (a) How many male students responded to questions in the survey? (b) What percentage, of those who responded to the question, stated that they were fairly good at using EXCEL? (c) Of the male respondents, what percentage were aged 20-24? (d) Of the female respondents who implied they used public transport, what proportion used free Wi-Fi? (e) What was the least popular social medium used in the last 24 hours prior to the survey? (f) If a respondent were selected at random, explain, giving suitable probabilities, whether or not it is likely that person was aged 20-24 and used 500MB-1GB of data per day on their mobile phone? (g) How likely is it that a randomly selected respondent was aged 20-24 or used 0 100MB of data per day on their mobile phone? (h) Create a stacked bar chart that shows the percentage, within each interval of daily mobile phone data usage, who have and do not have access to a library with Internet access within an hour of their home on foot or by public transport. Customise your chart by adding a suitable title, axes labels and a legend
Step by Step Solution
There are 3 Steps involved in it

Get step-by-step solutions from verified subject matter experts