

Question: QUESTION 2 The table below contains data recorded from a set of sensors . Store the data from the table above in six separate arrays
QUESTION
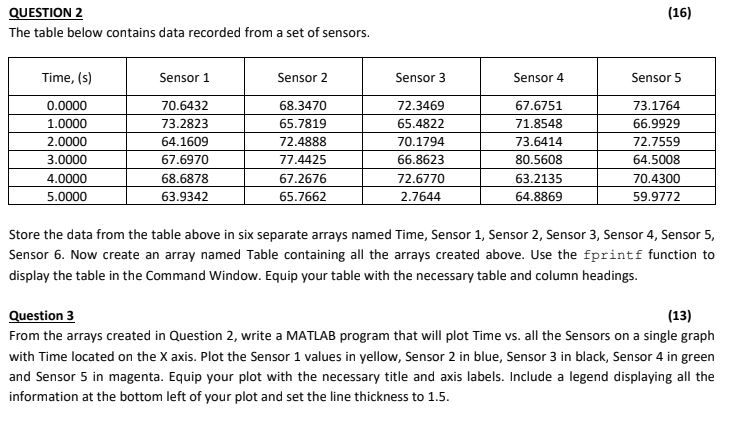
The table below contains data recorded from a set of sensors
Store the data from the table above in six separate arrays named Time, Sensor Sensor Sensor Sensor Sensor
Sensor Now create an array named Table containing all the arrays created above. Use the fprintf function to
display the table in the Command Window. Equip your table with the necessary table and column headings.
Question
From the arrays created in Question write a MATLAB program that will plot Time vs all the Sensors on a single graph
with Time located on the axis. Plot the Sensor values in yellow, Sensor in blue, Sensor in black, Sensor in green
and Sensor in magenta. Equip your plot with the necessary title and axis labels. Include a legend displaying all the
information at the bottom left of your plot and set the line thickness to
Step by Step Solution
There are 3 Steps involved in it
1 Expert Approved Answer
Step: 1 Unlock

Question Has Been Solved by an Expert!
Get step-by-step solutions from verified subject matter experts
Step: 2 Unlock
Step: 3 Unlock