

Question: Question 2 The table below show data that has been collected from different fields from various farms in a certain valley. The table contains the
Question 2
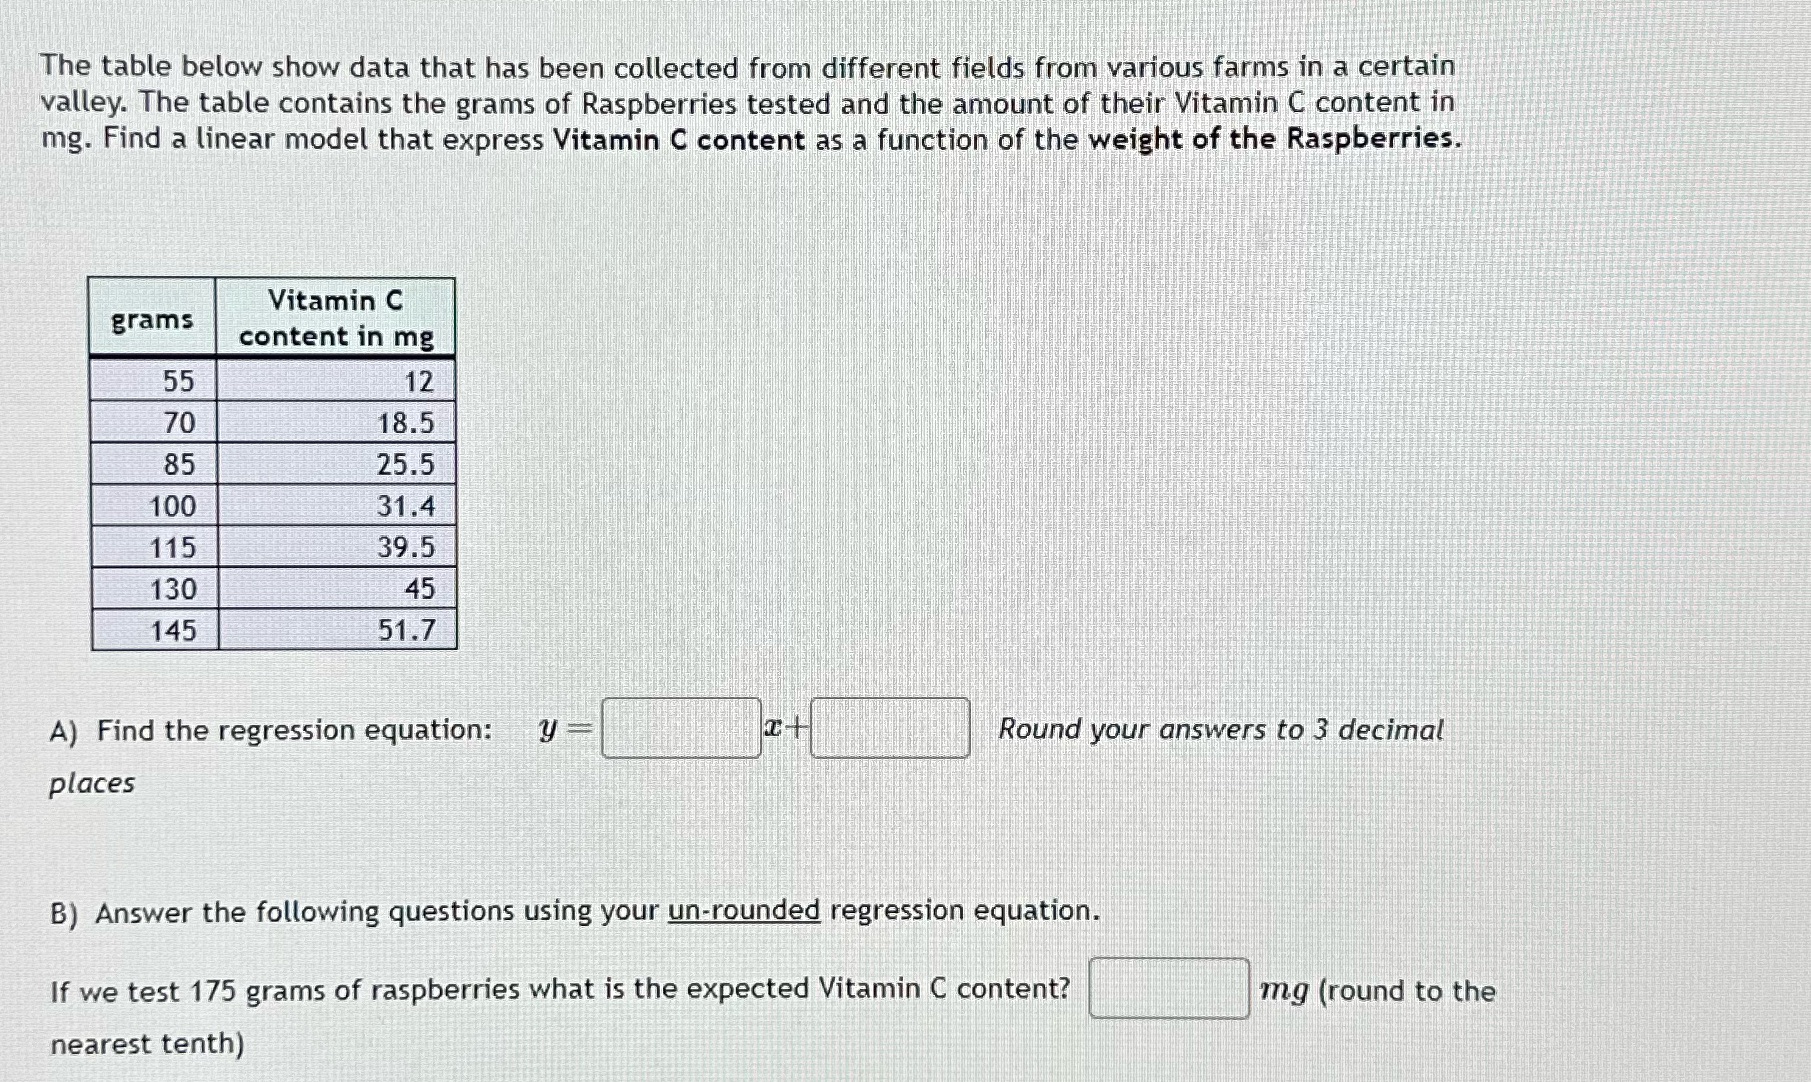
The table below show data that has been collected from different fields from various farms in a certain valley. The table contains the grams of Raspberries tested and the amount of their Vitamin C content in mg. Find a linear model that express Vitamin C content as a function of the weight of the Raspberries. Vitamin C grams content in mg 55 12 70 18.5 85 25.5 100 31.4 115 39.5 130 45 145 51.7 A) Find the regression equation: y Round your answers to 3 decimal places B) Answer the following questions using your un-rounded regression equation. If we test 175 grams of raspberries what is the expected Vitamin C content? mg (round to the nearest tenth)
Step by Step Solution
There are 3 Steps involved in it

Get step-by-step solutions from verified subject matter experts