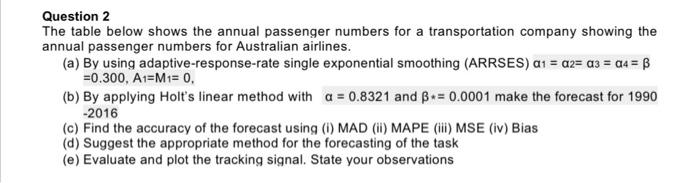
Question: Question 2 The table below shows the annual passenger numbers for a transportation company showing the annual passenger numbers for Australian airlines. (a) By using

Question 2 The table below shows the annual
Question 2 The table below shows the annual passenger numbers for a transportation company showing the annual passenger numbers for Australian airlines. (a) By using adaptive-response-rate single exponential smoothing (ARRSES) a1 = az= a3 = 24 = =0.300, A1=M1= 0. (b) By applying Holt's linear method with a = 0.8321 and B = 0.0001 make the forecast for 1990 -2016 (c) Find the accuracy of the forecast using (1) MAD (I) MAPE (1) MSE (iv) Bias (d) Suggest the appropriate method for the forecasting of the task (e) Evaluate and plot the tracking signal. State your observations

Step by Step Solution

There are 3 Steps involved in it

1 Expert Approved Answer
Step: 1 Unlock blur-text-image
Question Has Been Solved by an Expert!

Get step-by-step solutions from verified subject matter experts

Step: 2 Unlock
Step: 3 Unlock

Students Have Also Explored These Related General Management Questions!