

Question: Question 2 : The Zero Lower Bound 1 ) Plot since 2 0 0 0 the nominal interest rate on the Japanese long - term
Question : The Zero Lower Bound
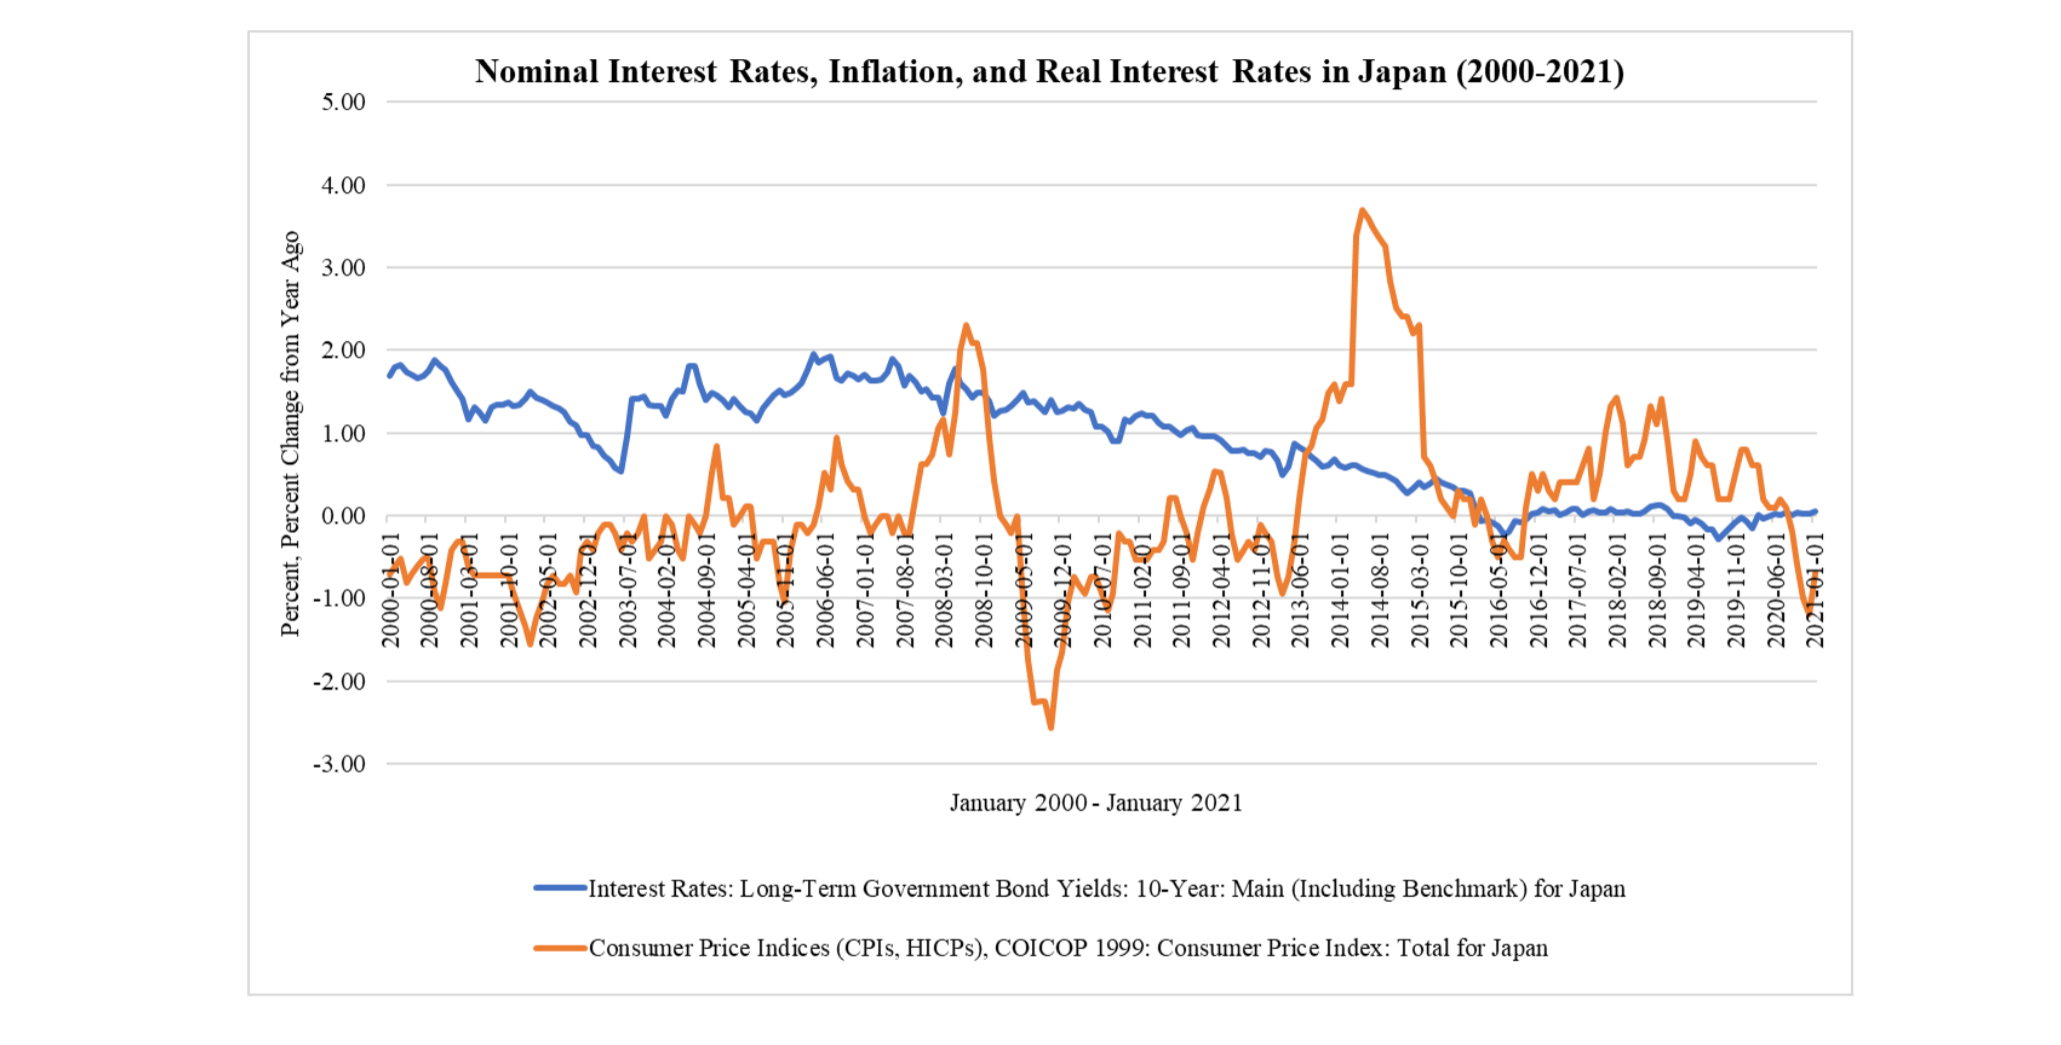
Plot since the nominal interest rate on the Japanese longterm yeargovernment bond FRED code: IRLTLTJPMNthe inflation rate based on the percentage change from a year ago of the Japan's consumer price index FRED code: JPNCIALLMINMEI, and then plot the estimated value of the real interest rate based on the difference between these two abovementioned indicators.
Comment on the lengthy period of the positive real rates since and the role of deflation in determining the real rate. Discuss the risks that the deflation poses in an economy with the nominal interest rate at the zero lower bound.
Could you help me answer question based on the graph? Nominal Interest Rates, Inflation, and Real Interest Rates in Japan
qquad
Interest Rates: LongTerm Government Bond Yields: Year: Main Including Benchmark for Japan
Consumer Price Indices CPIs HICPs COICOP : Consumer Price Index: Total for Japan
Step by Step Solution
There are 3 Steps involved in it
1 Expert Approved Answer
Step: 1 Unlock

Question Has Been Solved by an Expert!
Get step-by-step solutions from verified subject matter experts
Step: 2 Unlock
Step: 3 Unlock