

Question: Question 2. This question uses the simple regression model to study the influence of the independent variable on the profit rate, for each research
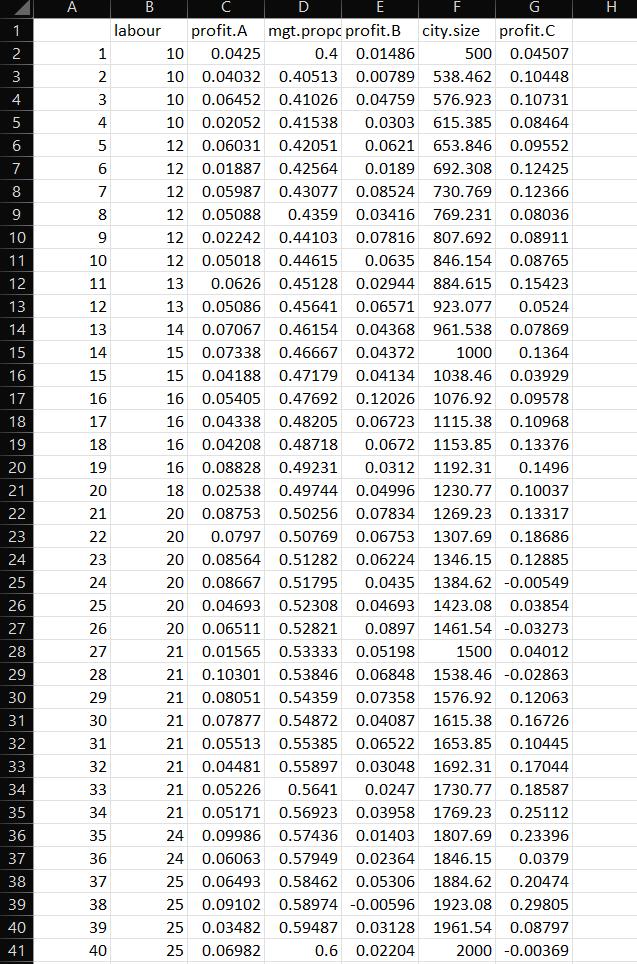
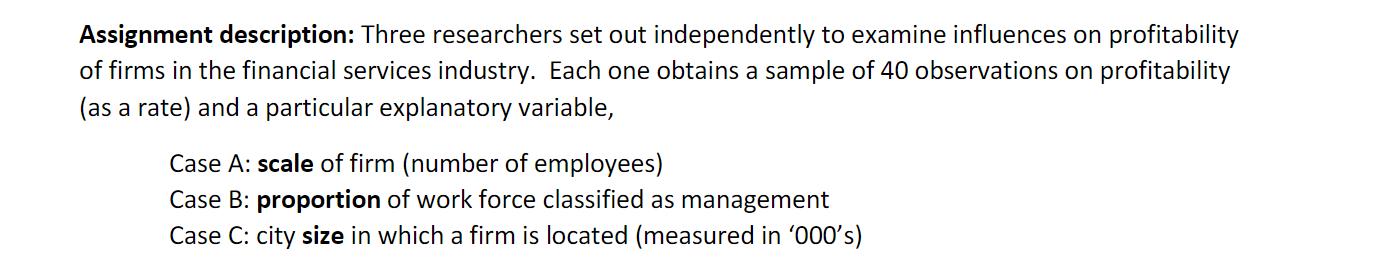
Question 2. This question uses the simple regression model to study the influence of the independent variable on the profit rate, for each research study (A, B, C). We will assess the applicability and use the following models (treated separately) where appropriate, Case/Sample A: profitA = Bo + Bscale; + & Case/Sample B: profitB = o + Bproportion + Case/Sample C: profitC = Bo + Bsize + Ei a) (9 marks) Estimate the linear regression model (find the line of best fit) for each of the models above. Plot the data along with the fitted line arising from your simple regression estimation. b) (9 marks) On the basis of the scatter plots in a), do the following assumptions for the simple regression model hold in each case (A, B, C)? i) ii) iii) regressor (ie independent variable) fixed in repeated sample, ie non-random; the error terms are statistically independent random variables, unrelated to the explanatory variables, assumed to be normally distributed and with zero expected value and equal, constant variance; a linear form can be assumed for the deterministic model relating the dependent variable (profit) and the independent model (respectively, scale, proportion, size). c) (6 marks) For the case(s) in b) that appear to conform to the assumptions of the model, proceed to test the following hypotheses about the slope coefficient at the 1% significance level, Model A: scale B: proportion C: size Test #1 Hypotheses Ho: P1 = 0 vs. HA: B # 0 Ho: B = 0 vs. HA: B = 0 Ho: P0 vs. HA: P = 0 Test #2 Hypotheses Ho: P 0.003 vs. HA: B 0.003 Ho: B-0.06 vs. HA: P -0.06 Ho: P 0.00004 vs. HA: P> 0.00004 d) (6 marks) For the case(s) in b) that do not conform to the assumptions of the simple regression model, can you propose an alternative plan for data collection, estimation and testing (using the techniques we have covered in the course) to deal with the problem(s) you found above? Explain for each case. 1 2 3 4 5 6 7 8 9 10 11 12 13 14 15 16 17 18 19 20 21 22 23 24 25 26 27 28 29 30 31 32 33 34 35 36 37 38 39 40 41 A 1 2 3 4 5 6 7 8 9 10 11 12 13 14 15 16 17 18 19 20 21 22 23 24 25 26 27 28 29 30 31 32 33 34 35 36 37 38 39 40 B labour D G mgt.propc profit.B city.size profit.C profit.A 0.0425 10 0.4 0.01486 500 0.04507 10 0.04032 0.40513 0.00789 538.462 0.10448 10 0.06452 0.41026 0.04759 576.923 0.10731 10 0.02052 0.41538 0.0303 615.385 0.08464 12 0.06031 0.0621 653.846 0.09552 0.42051 0.42564 12 0.01887 0.0189 692.308 0.12425 12 0.05987 0.43077 0.08524 730.769 0.12366 12 0.05088 12 0.02242 12 0.05018 0.4359 0.03416 769.231 0.08036 0.44103 0.07816 807.692 0.08911 0.44615 0.0635 846.154 0.08765 0.45128 0.02944 884.615 0.15423 0.45641 0.06571 923.077 0.0524 0.46154 13 0.0626 13 0.05086 14 0.07067 0.04368 961.538 0.07869 15 0.07338 0.46667 0.04372 1000 0.1364 0.47179 0.04134 1038.46 0.03929 1076.92 0.09578 15 0.04188 16 0.05405 16 0.04338 16 0.04208 16 0.08828 0.10968 0.47692 0.12026 0.48205 0.06723 1115.38 0.48718 0.49231 0.0672 1153.85 0.13376 0.0312 1192.31 0.1496 0.49744 0.04996 1230.77 0.10037 18 0.02538 20 0.08753 0.50256 0.07834 1269.23 0.13317 20 0.0797 0.50769 0.06753 1307.69 0.18686 0.51282 0.06224 1346.15 0.12885 0.0435 1384.62 -0.00549 1423.08 0.03854 1461.54 -0.03273 1500 0.04012 1538.46 -0.02863 1576.92 0.12063 1615.38 0.16726 1653.85 0.10445 20 0.08564 20 0.08667 0.51795 20 0.04693 0.52308 0.04693 20 0.06511 0.52821 0.0897 21 0.01565 0.53333 0.05198 21 0.10301 0.53846 0.06848 21 0.08051 0.54359 0.07358 21 0.07877 0.54872 0.04087 21 0.05513 0.55385 0.06522 21 0.04481 0.55897 0.05226 0.5641 0.05171 0.56923 0.03958 1769.23 0.25112 0.09986 0.57436 0.01403 1807.69 0.23396 0.57949 0.02364 1846.15 0.0379 0.58462 0.05306 1884.62 0.20474 0.58974 -0.00596 1923.08 0.29805 0.59487 0.03128 1961.54 0.08797 2000 -0.00369 0.03048 1692.31 0.17044 21 0.0247 1730.77 0.18587 0.06063 0.06493 25 0.09102 25 0.03482 25 0.06982 0.6 0.02204 8 8 8 8 8 8 8 8 8 8 4 4 4 4 4 4 4 4 4 3 3 3 3 3 21 24 24 25 H Assignment description: Three researchers set out independently to examine influences on profitability of firms in the financial services industry. Each one obtains a sample of 40 observations on profitability (as a rate) and a particular explanatory variable, Case A: scale of firm (number of employees) Case B: proportion of work force classified as management Case C: city size in which a firm is located (measured in '000's)
Step by Step Solution
3.37 Rating (150 Votes )
There are 3 Steps involved in it
Here are my responses to the questions a I do not have the actual data for samples A B and C so I ca... View full answer

Get step-by-step solutions from verified subject matter experts