

Question: ??????? Question 2. Three samples, each consisting of 4 units, have been measured. The results are recorded in the following table: Unit 1 Unit 2
???????
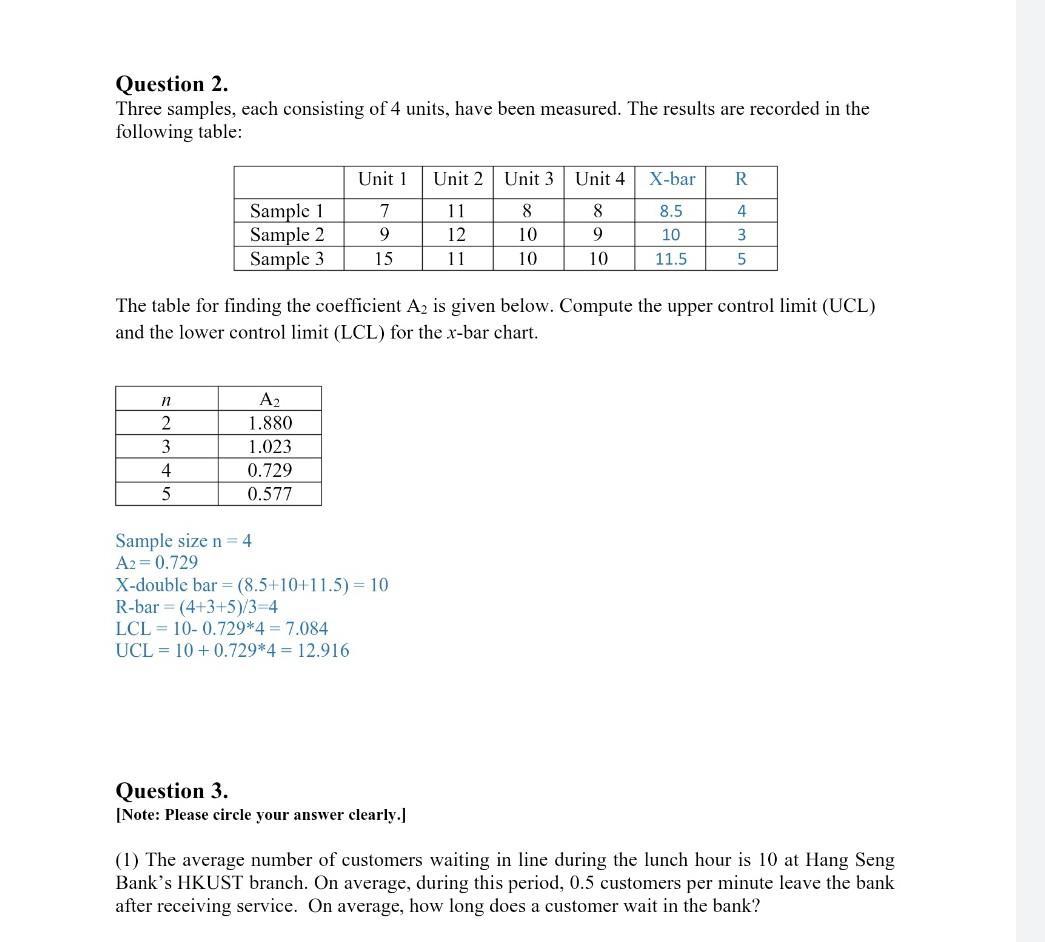
Question 2. Three samples, each consisting of 4 units, have been measured. The results are recorded in the following table: Unit 1 Unit 2 Unit 3 Unit 4 X-bar R 4 Sample 1 Sample 2 Sample 3 7 9 15 11 12 11 8 10 10 8 9 8.5 10 11.5 3 5 10 The table for finding the coefficient Ais given below. Compute the upper control limit (UCL) and the lower control limit (LCL) for the x-bar chart. n 2 3 4 5 A2 1.880 1.023 0.729 0.577 Sample size n 4 A2=0.729 X-double bar = (8.5+10+11.5) = 10 R-bar = (4+3+5)/3-4 LCL = 10- 0.729*4=7.084 UCL = 10 +0.729*4 = 12.916 Question 3. [Note: Please circle your answer clearly.] (1) The average number of customers waiting in line during the lunch hour is 10 at Hang Seng Bank's HKUST branch. On average, during this period, 0.5 customers per minute leave the bank after receiving service. On average, how long does a customer wait in the bankStep by Step Solution
There are 3 Steps involved in it
1 Expert Approved Answer
Step: 1 Unlock

Question Has Been Solved by an Expert!
Get step-by-step solutions from verified subject matter experts
Step: 2 Unlock
Step: 3 Unlock