

Question: Question 2: Use the data given in Excel: lecture 6 data file - Sheet named Ex Q2. The given data on average public teacher
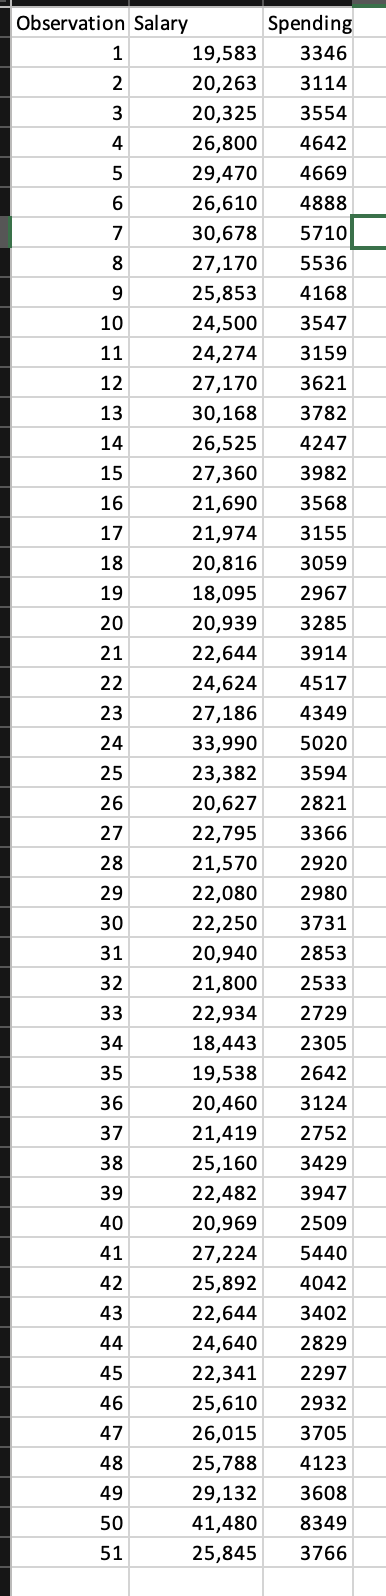
Question 2: Use the data given in Excel: lecture 6 data file - Sheet named Ex Q2. The given data on average public teacher pay (annual salary in dollars) and spending on public schools per pupil (dollars) in 1985 for 50 states and the District of Columbia. To find out if there is any relationship between teacher's pay and per pupil expenditure in public schools, the following model was suggested: Payi = Bo+ B1 Spendi + ui, where Pay stands for teacher's salary and Spend stands for per pupil expenditure. a. Apply OLS by using LINEST function to estimate the parameters. Page 1 of 3 b. Plot the data and the regression line on the same sketch. c. Point out the estimators' standard errors, r, RSS, and ESS. d. Interpret the regression. Does it make economic sense? e. Test the hypothesis that the slop parameter equals to 3 at level of confidence 5% and then at 1%. Observation Salary Spending 1 19,583 3346 234 50 69 2 20,263 3114 3 20,325 3554 26,800 4642 29,470 4669 26,610 4888 30,678 5710 8 27,170 5536 9 25,853 4168 10 24,500 3547 11 24,274 3159 12 27,170 3621 13 30,168 3782 14 26,525 4247 15 27,360 3982 16 21,690 3568 17 21,974 3155 18 20,816 3059 19 18,095 2967 20 20,939 3285 21 22,644 3914 22 24,624 4517 23 27,186 4349 24 33,990 5020 25 23,382 3594 26 20,627 2821 27 22,795 3366 28 21,570 2920 29 22,080 2980 30 22,250 3731 31 20,940 2853 32 21,800 2533 33 22,934 2729 34 18,443 2305 35 19,538 2642 36 20,460 3124 37 21,419 2752 38 25,160 3429 39 22,482 3947 40 20,969 2509 41 27,224 5440 42 25,892 4042 43 22,644 3402 44 24,640 2829 45 22,341 2297 46 25,610 2932 47 26,015 3705 48 25,788 4123 49 29,132 3608 50 41,480 8349 51 25,845 3766
Step by Step Solution
There are 3 Steps involved in it

Get step-by-step solutions from verified subject matter experts