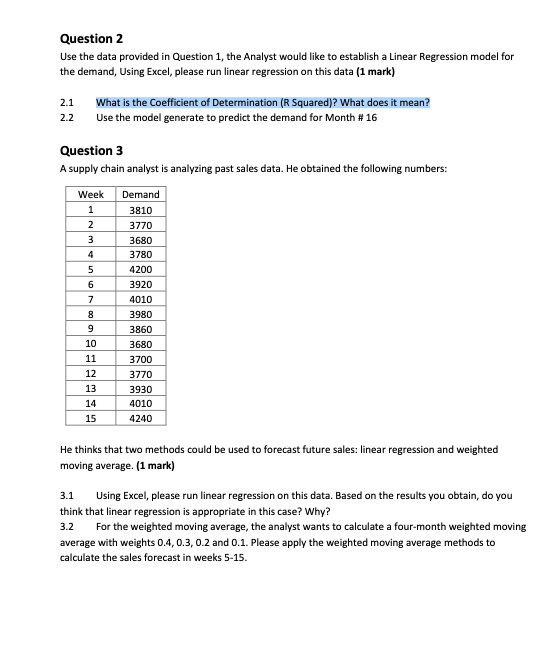
Question: Question 2 Use the data provided in Question 1, the Analyst would like to establish a Linear regression model for the demand, Using Excel, please

Question 2 Use the data provided in Question 1,Question 2 Use the data provided in Question 1,

Question 2 Use the data provided in Question 1, the Analyst would like to establish a Linear regression model for the demand, Using Excel, please run linear regression on this data (1 mark) 2.1 2.2 What is the Coefficient of Determination ( Squared? What does it mean? Use the model generate to predict the demand for Month # 16 Question 3 A supply chain analyst is analyzing past sales data. He obtained the following numbers: Week Demand 1 2 3 4 5 6 7 8 9 10 11 12 13 14 15 3810 3770 3680 3780 4200 3920 4010 3980 3860 3680 3700 3770 3930 4010 4240 He thinks that two methods could be used to forecast future sales: linear regression and weighted moving average. (1 mark) 3.1 Using Excel, please run linear regression on this data. Based on the results you obtain, do you think that linear regression is appropriate in this case? Why? 3.2 For the weighted moving average, the analyst wants to calculate a four-month weighted moving average with weights 0.4, 0.3, 0.2 and 0.1. Please apply the weighted moving average methods to calculate the sales forecast in weeks 5-15. APPENDIX: Suggestions for implementing Question 1-3 in Excel: 1. Create a single excel file for all three questions 2. Create a separate excel worksheet for each question 3. Make a table in Excel (one column for the month, another with the given demand data) 4. Rest of the columns in excel sheet can be used for you working. 5. Label each column with headings and other information so that it is easily understandable 6. Solutions to the discussion aspects of the questions should be submitted in a word file with appropriate reference to the analysis in excels workbook Guidelines: Each group can consist of two students at maximum. Each group has to submit a report file (.doc) to answer the case questions and an excel file with all calculations before Thursday 15h October 2020 at 11.59PM. Each question should be solved on a separate sheet in Excel (total 3 sheets) Submission must be done on Blackboard. The report must include a cover page indicating the part worked out by each student Both excel file and report file (in word) names should contain the student IDs of all group members for example report file should be named as Assignment1_2018XXXXXX_2018YYYYYY.docx and excel file should be names as Assignment1_2018XXXXX_2018YYYYYY.xlsx, where 2018XXXXX and 2018YYYYYY are student IDs for both group members. Grading Assignment-1 will account for 4% of the course grade. The criteria that will be considered for grading Assignment 1 are as follows: Correct Excel calculations and formulas Quality of the comments and answers to questions in the report

Step by Step Solution

There are 3 Steps involved in it

1 Expert Approved Answer
Step: 1 Unlock blur-text-image
Question Has Been Solved by an Expert!

Get step-by-step solutions from verified subject matter experts

Step: 2 Unlock
Step: 3 Unlock

Students Have Also Explored These Related General Management Questions!