

Question: Use the following table to construct a complete frequency distribution table of the 2008 state sales tax rates of the 50 states and the
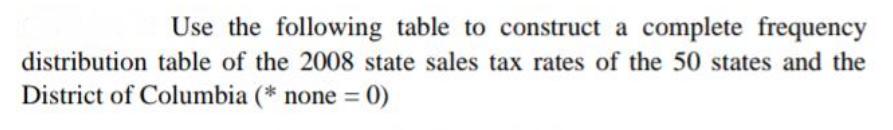

Use the following table to construct a complete frequency distribution table of the 2008 state sales tax rates of the 50 states and the District of Columbia (* none = 0) %3D State Sales Tax Rates, January 1, 2008 State Tax rates State Tax rates State Tax rates Alabama 4 Louisiana 4 Ohio 5.5 Alaska none Maine Oklahoma 4.5 Oregon Pennsylvania Arizona 5.6 Maryland none Arkansas Massachusetts California 7.25 Michigan Rhode Island 7 Colorado 2.9 Minnesota 6.5 South Carolina Connecticut Mississippi South Dakota 4 Delaware none Missouri 4.225 Tennessee 7 Florida Montana none as 6.25 Georgia Nebraska 5.5 Utah 4.65 Hawaii Nevada 6.5 Vermont Idaho 6. New Hampshire none Virginia 5 Ilinois 6.25 New Jersey 7 Washington 6.5 Indiana New Mexico West Virginia 6 lowa New York 4 Wisconsin 5 Kansas 5.3 North Carolina 4.25 Wyoming 4 Kentucky North Dakota Dist. of Columbia 5.75 5o5 64 + Construct an Histogram for the Tax Rate. + Find mean, median, mode, geometric mean, and harmonic mean for ungrouped data. + Comments over the skewness pattern of each month. Is there any relation between the averages?
Step by Step Solution
3.42 Rating (149 Votes )
There are 3 Steps involved in it
The frequency table in ascending order is given as below Tax Frequency Total Tax 1Total Tax None 5 0 ... View full answer

Get step-by-step solutions from verified subject matter experts