

Question: Question 2. Using both latest_poverty and population, create a four-column table called recent_poverty_total with one row for each country in latest_poverty. The four columns should
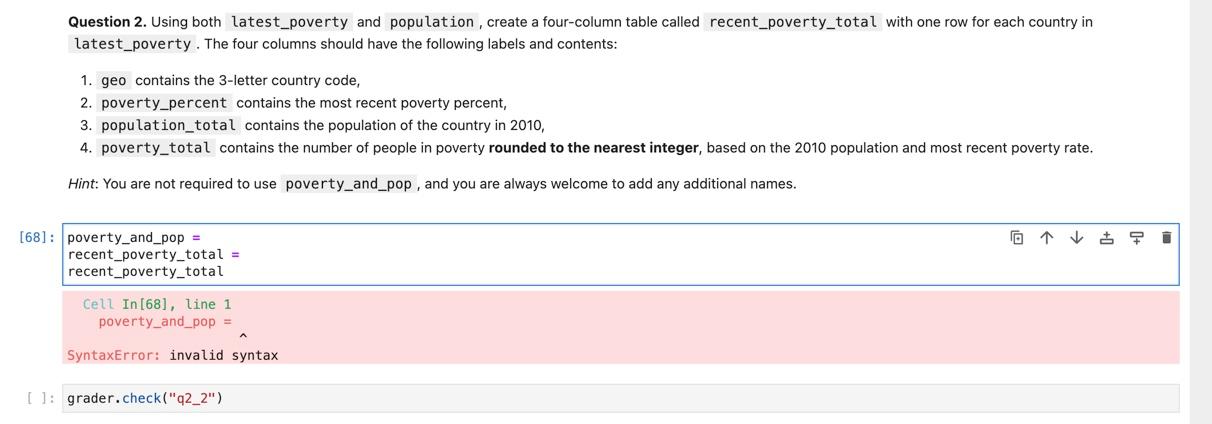
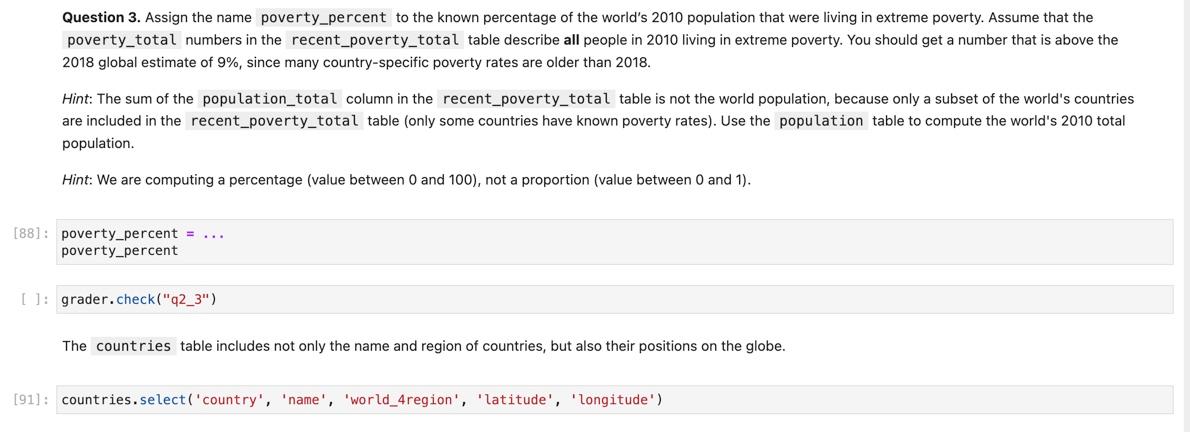
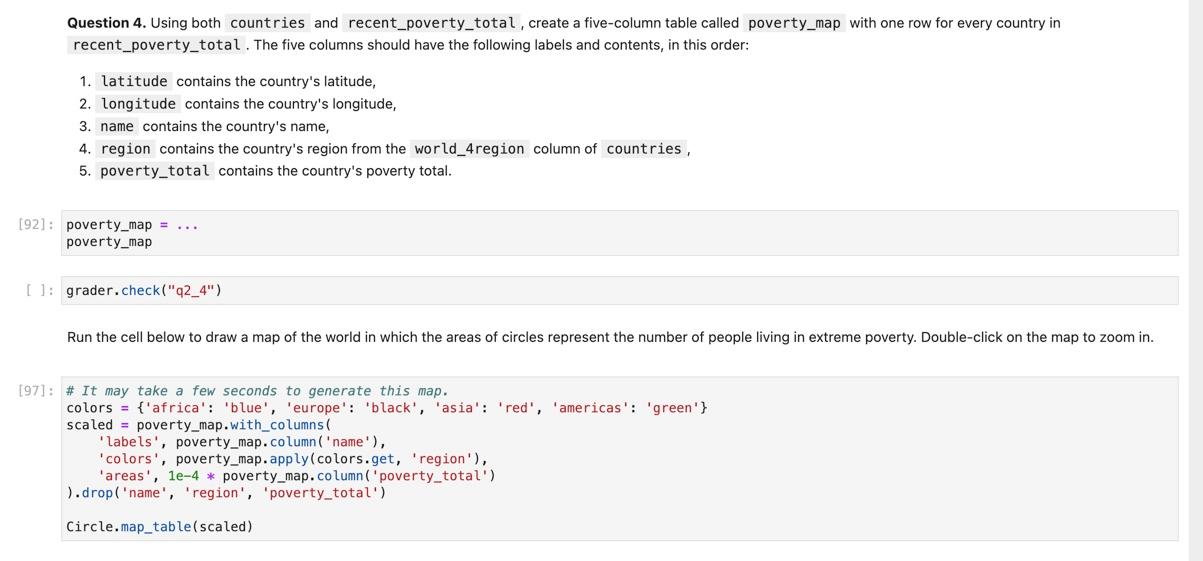
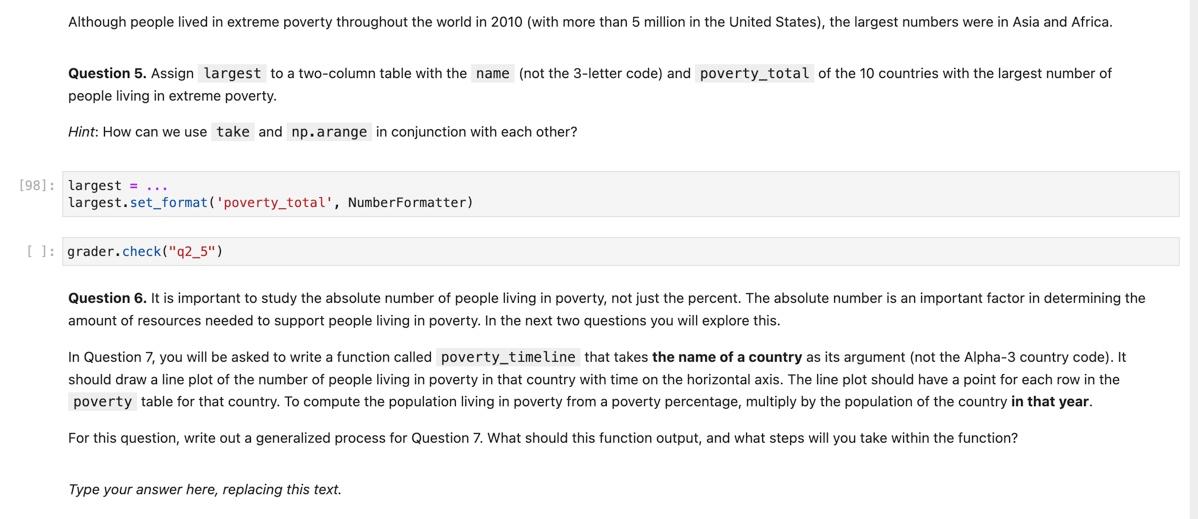
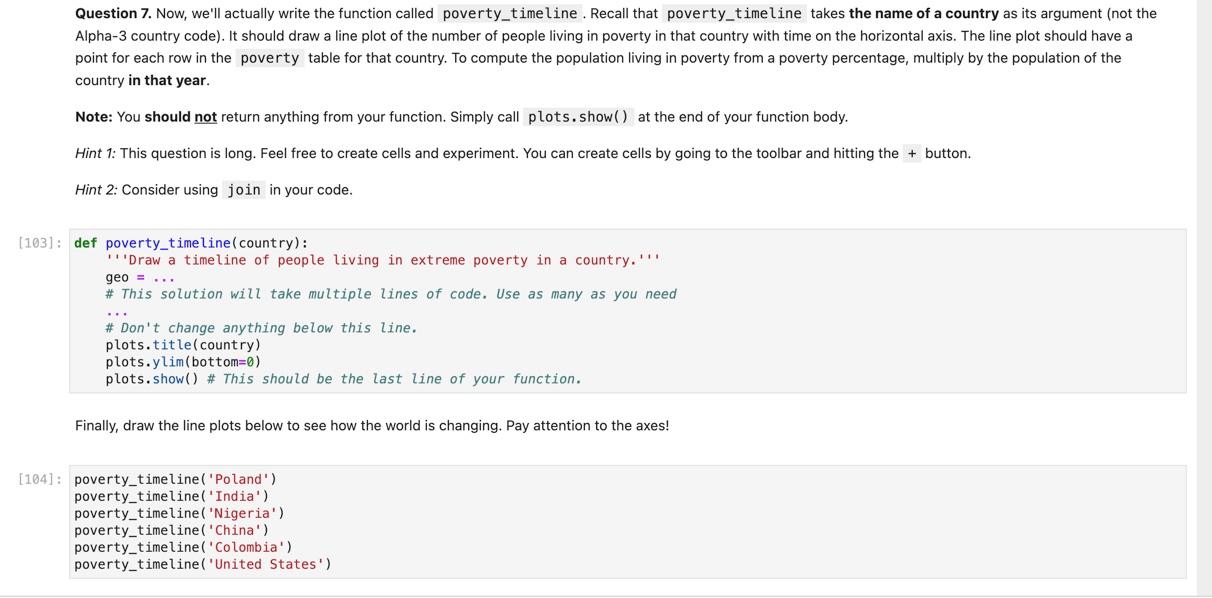
Question 2. Using both latest_poverty and population, create a four-column table called recent_poverty_total with one row for each country in latest_poverty. The four columns should have the following labels and contents: 1. geo contains the 3 -letter country code, 2. poverty_percent contains the most recent poverty percent, 3. population_total contains the population of the country in 2010 , 4. poverty_total contains the number of people in poverty rounded to the nearest integer, based on the 2010 population and most recent poverty rate. Hint: You are not required to use poverty_and_pop, and you are always welcome to add any additional names. Question 3. Assign the name poverty_percent to the known percentage of the world's 2010 population that were living in extreme poverty. Assume that the poverty_total numbers in the recent_poverty_total table describe all people in 2010 living in extreme poverty. You should get a number that is above the 2018 global estimate of 9%, since many country-specific poverty rates are older than 2018. Hint: The sum of the population_total column in the recent_poverty_total table is not the world population, because only a subset of the world's countries are included in the recent_poverty_total table (only some countries have known poverty rates). Use the population table to compute the world's 2010 total population. Hint: We are computing a percentage (value between 0 and 100), not a proportion (value between 0 and 1 ). poverty_percent = poverty_percent ]: grader.check("q2_3") The countries table includes not only the name and region of countries, but also their positions on the globe. L1: countries.select('country', 'name', 'world_4region', 'latitude', 'longitude') Question 4. Using both countries and recent_poverty_total, create a five-column table called poverty_map with one row for every country in recent_poverty_total. The five columns should have the following labels and contents, in this order: 1. Latitude contains the country's latitude, 2. longitude contains the country's longitude, 3. name contains the country's name, 4. region contains the country's region from the world_4region column of countries, 5. poverty_total contains the country's poverty total. \[ \text { poverty_map }=\ldots \] poverty_map grader.check("q2-4") Run the cell below to draw a map of the world in which the areas of circles represent the number of people living in extreme poverty. Double-click on the map to zoom in. \# It may take a few seconds to generate this map. colors = \{'africa': 'blue', 'europe': 'black', 'asia': 'red', 'americas': 'green' scaled = poverty_map.with_columns( 'labels', poverty_map. column('name'), 'colors', poverty_map.apply(colors.get, 'region'), 'areas', le-4 * poverty_map.column('poverty_total') ).drop('name', 'region', 'poverty_total') Circle.map_table(scaled) Although people lived in extreme poverty throughout the world in 2010 (with more than 5 million in the United States), the largest numbers were in Asia and Africa. Question 5. Assign largest to a two-column table with the (not the 3-letter code) and poverty_total of the 10 countries with the largest number of people living in extreme poverty. Hint: How can we use take and np.arange in conjunction with each other? largest = largest.set_format ('poverty_total', NumberFormatter) grader.check("q2_5") Question 6. It is important to study the absolute number of people living in poverty, not just the percent. The absolute number is an important factor in determining the amount of resources needed to support people living in poverty. In the next two questions you will explore this. In Question 7, you will be asked to write a function called poverty_timeline that takes the name of a country as its argument (not the Alpha-3 country code). It should draw a line plot of the number of people living in poverty in that country with time on the horizontal axis. The line plot should have a point for each row the poverty table for that country. To compute the population living in poverty from a poverty percentage, multiply by the population of the country in that year. For this question, write out a generalized process for Question 7. What should this function output, and what steps will you take within the function? Type your answer here, replacing this text. Question 7. Now, we'll actually write the function called poverty_timeline. Recall that poverty_timeline takes the name of a country as its argument (not the Alpha-3 country code). It should draw a line plot of the number of people living in poverty in that country with time on the horizontal axis. The line plot should a point for each row in the poverty table for that country. To compute the population living in poverty from a poverty percentage, multiply by the population of the country in that year. Note: You should not return anything from your function. Simply call plots. show() at the end of your function body. Hint 1: This question is long. Feel free to create cells and experiment. You can create cells by going to the toolbar and hitting the + button. Hint 2: Consider using join in your code. 3]: def poverty_timeline(country): "Draw a timeline of people living in extreme poverty in a country. "' geo = .. \# This solution will take multiple lines of code. Use as many as you need \# Don't change anything below this line. plots.title(country) plots.ylim(bottom=0) plots. show() \# This should be the last line of your function. Finally, draw the line plots below to see how the world is changing. Pay attention to the axes! 4]: poverty_timeline('Poland') poverty_timeline('India') poverty_timeline('Nigeria') poverty_timeline('China') poverty_timeline('Colombia') poverty_timeline('United States')
Step by Step Solution
There are 3 Steps involved in it
Sure lets go through each question step by step Question 2 Create recentpovertytotal Merge Tables Join the latestpoverty and population tables on the ... View full answer

Get step-by-step solutions from verified subject matter experts