

Question: Question 2: Using the data that is provided (Thunder Dataset HW2) answer the following: (a) Define what each variable is in the able below: Qualitative/Quantitative
Question 2:
Using the data that is provided (Thunder Dataset HW2) 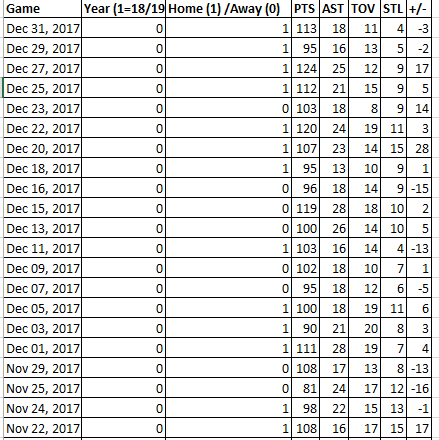


answer the following:
(a) Define what each variable is in the able below: Qualitative/Quantitative
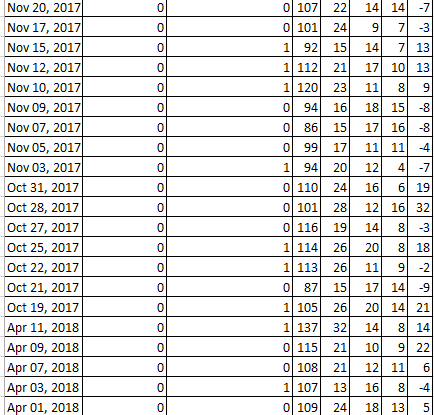
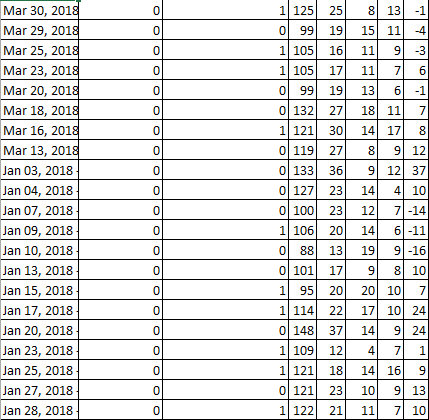
The data consist of 7 variables on the 133 games for the Thunder for the 2017-19 seasons
| Variable | Qual or Quant |
| +/- | |
| Year | |
| Game | |
| Home vs Away | |
| Points | |
| AST | |
| TOV | |
| STL |
(b) Create a frequency distribution for the variable Points using the classes 80 -89, 90-99, 100-109, 110-119, 120-129, 130-139 and 140-149. Using your frequency distribution create a histogram. What do you notice about the shape of the histogram? Use your values for mean and median from (C) to aid in your explanation. Make sure to put both the table and figure here.
(c) Find the min, max, average, median, mode, variance and standard deviation for the variables +/-, PTS, AST. Interpret what the value for standard deviation tells you. Place the chart of your results here.
| Variable | Min | Max | Mean | Median | Variance | SD |
| +/- | ||||||
| Points | ||||||
| AST |
Only use 1 decimal place
(d) In excel or using R, find the correlations between +/-, PTS, AST, TOV. What does this tell you about how each of the variables are related? Explain. Put the correlation matrix here.
| Variable | +/- | Points | AST | TOV |
| +/- | ||||
| Pts | ||||
| AST | ||||
| TOV |
*use 3 decimal places
(e)Would it be appropriate to also include Home/Away in correlation? Explain
(f) Use the data provided to create 4 regression models to predict how PTS and AST are related to +/- .
In model 1 and 2 you consider Points and AST alone; Model 3 consider AST and Points together; Model 4 consider Points and Assists and their squared terms along with an interaction (Pts*Ast). Put your results in the table below.
*to create model 4, you need to create new columns for Points-Sq. and AST-Sq. and also create a column where you multiply points*AST if you are using excel. You can then use those in the regression. In R you simply need to change the model statement appropriately.
| Model | Variable | Coefficient | T-Stat | P-Value | Adj-R2 |
| 1 | Intercept Points | ||||
| 2 | Intercept AST | ||||
| 3 | Intercept Points AST | ||||
| 4 | Intercept Points Points-Sq AST AST-Sq Points*Assists |
*for Coeff, T-stat use 2 decimal places, p-value 4 decimals, Adj-R2 3 decimals
**note that the variables noted in the 2nd column are the variables that are to be used in each model. So the number of coefficients, t-test and p-values should reflect that. For example, in model 1 there should be 2 coefficients, t-stats and p-values for the 2 corresponding variables.
g) Which model does the best job of predicting +/-. Explain. Which variables are influential in predicting +/-?
9 8 1 Game Year (1=18/19 Home (1) /Away (0) PTS AST TOV STL +/- Dec 31, 2017 0 1 113 18 11 41 -3 Dec 29, 2017 0 1 95 16 13 5 -2 Dec 27, 2017 0 1 124 25 12 9 17 Dec 25, 2017 0 1 112 21 15 9 5 Dec 23, 2017 0 0 103 18 8 9| 14 Dec 22, 2017 0 1 120 24 19 11 3 Dec 20, 2017 0 1 107) 23 14 15 28 Dec 18, 2017 0 1 95 13 10 9 Dec 16, 2017 01 ol 96 18 14 91-15 Dec 15, 2017 01 0 119 28 18 101 2 Dec 13, 2017 0 0 100 26 14 101 Dec 11, 2017 0 1 103 16 14 41-13 Dec 09, 2017 0 0 102 18 10 7 1 Dec 07, 2017 0 ol 95 18 12 6 -5 Dec 05, 2017 0 1 100 18 19 11 6 Dec 03, 2017 0 1 90 21 20 3 Dec 01, 2017 0 1 111 28 19 7 Nov 29, 2017 0 0 108 17 13 81-13 Nov 25, 2017 0 81 24 17| 12-16 Nov 24, 2017 0 1 98 22 15 13 -1 Nov 22, 2017 0 1 108 16 17|15| 17 5 8 3 4 6 0 0 107 0 101 22 24 15 0 14 14 14 -7 9 7 3 9 0 1] 92 14 7| 13 0 1 112 21 0 1120 23 0 01 94 16 0 86 15 ol 99 17 0 0 0 0 1 94 20 17 10 13 11 8 9 18 15 15 - 8 17| 16 161 -8 11 11 11 -4 12 4 -71 16 6) 19 12 16 32 14 8 -3 20 81 18 11 9 -2 17| 14 14-9 ol 110 Nov 20, 2017 Nov 17, 2017 Nov 15, 2017 Nov 12, 2017 Nov 10, 2017 Nov 09, 2017 Nov 07, 2017 Nov 05, 2017 Nov 03, 2017 Oct 31, 2017 Oct 28, 2017 Oct 27, 2017 Oct 25, 2017 Oct 22, 2017 Oct 21, 2017 Oct 19, 2017 Apr 11, 2018 Apr 09, 2018 Apr 07, 2018 Apr 03, 2018 Apr 01, 2018 24 0 0 0 101 28 0 116 19 1 114 26 1 113 26 0 0 0 01 87 15 0 1 105 26 20 14 21 0 14 8 14 0 10 91 22 1 137 32 0 115 21 0 108 21 1 107 13 0 12 11 6 0 16 81 -4 0 0 1091 24 18 13 | 0 0 107 0 101 22 24 15 0 14 14 14 -7 9 7 3 9 0 1] 92 14 7| 13 0 1 112 21 0 1120 23 0 01 94 16 0 86 15 ol 99 17 0 0 0 0 1 94 20 17 10 13 11 8 9 18 15 15 - 8 17| 16 161 -8 11 11 11 -4 12 4 -71 16 6) 19 12 16 32 14 8 -3 20 81 18 11 9 -2 17| 14 14-9 ol 110 Nov 20, 2017 Nov 17, 2017 Nov 15, 2017 Nov 12, 2017 Nov 10, 2017 Nov 09, 2017 Nov 07, 2017 Nov 05, 2017 Nov 03, 2017 Oct 31, 2017 Oct 28, 2017 Oct 27, 2017 Oct 25, 2017 Oct 22, 2017 Oct 21, 2017 Oct 19, 2017 Apr 11, 2018 Apr 09, 2018 Apr 07, 2018 Apr 03, 2018 Apr 01, 2018 24 0 0 0 101 28 0 116 19 1 114 26 1 113 26 0 0 0 01 87 15 0 1 105 26 20 14 21 0 14 8 14 0 10 91 22 1 137 32 0 115 21 0 108 21 1 107 13 0 12 11 6 0 16 81 -4 0 0 1091 24 18 13 | 0 25 19 0 0 8 13 -1 15 11 4 11 91 3 16 1 125 01 99 1 105 1 105 0 99 0 132 1 121 17 11 7 0 0 6 19 0 27 0 30 13 61 -1 18 11 7 14 17 8 9 12 9 12 37 0 0 119 27 8 0 0 133 36 0 0|127 23 14 4 10 Mar 30, 2018 , Mar 29, 2018 Mar 25, 2018 Mar 23, 2018 Mar 20, 2018 Mar 18, 2018 Mar 16, 2018 Mar 13, 2018 Jan 03, 2018 Jan 04, 2018 Jan 07, 2018 Jan 09, 2018 Jan 10, 2018 Jan 13, 2018 Jan 15, 2018 Jan 17, 2018 Jan 20, 2018 Jan 23, 2018 Jan 25, 2018 Jan 27, 2018 Jan 28, 2018 0 0 100 23 12 71-14 0 1 106 20 141 61-11 0 01 88 13 1 0 17 0 101 1 95 0 20 0 0 0 0 22 37 12 1 114 0 148 1 109 1 121 0 121 1 122 19 91-16 9 8 10 2010 7 17 10 24 14 9 24 4 7 1 14 16 9 10 9 13 11 7 10 1 9 18 0 23 0 21 0 25 19 0 0 8 13 -1 15 11 4 11 91 3 16 1 125 01 99 1 105 1 105 0 99 0 132 1 121 17 11 7 0 0 6 19 0 27 0 30 13 61 -1 18 11 7 14 17 8 9 12 9 12 37 0 0 119 27 8 0 0 133 36 0 0|127 23 14 4 10 Mar 30, 2018 , Mar 29, 2018 Mar 25, 2018 Mar 23, 2018 Mar 20, 2018 Mar 18, 2018 Mar 16, 2018 Mar 13, 2018 Jan 03, 2018 Jan 04, 2018 Jan 07, 2018 Jan 09, 2018 Jan 10, 2018 Jan 13, 2018 Jan 15, 2018 Jan 17, 2018 Jan 20, 2018 Jan 23, 2018 Jan 25, 2018 Jan 27, 2018 Jan 28, 2018 0 0 100 23 12 71-14 0 1 106 20 141 61-11 0 01 88 13 1 0 17 0 101 1 95 0 20 0 0 0 0 22 37 12 1 114 0 148 1 109 1 121 0 121 1 122 19 91-16 9 8 10 2010 7 17 10 24 14 9 24 4 7 1 14 16 9 10 9 13 11 7 10 1 9 18 0 23 0 21Step by Step Solution
There are 3 Steps involved in it

Get step-by-step solutions from verified subject matter experts