

Question: Question 2 What quantity (@) will the profit-maximizing (P) will they charge, and how much will their profit or loss be? Price (in thousands of


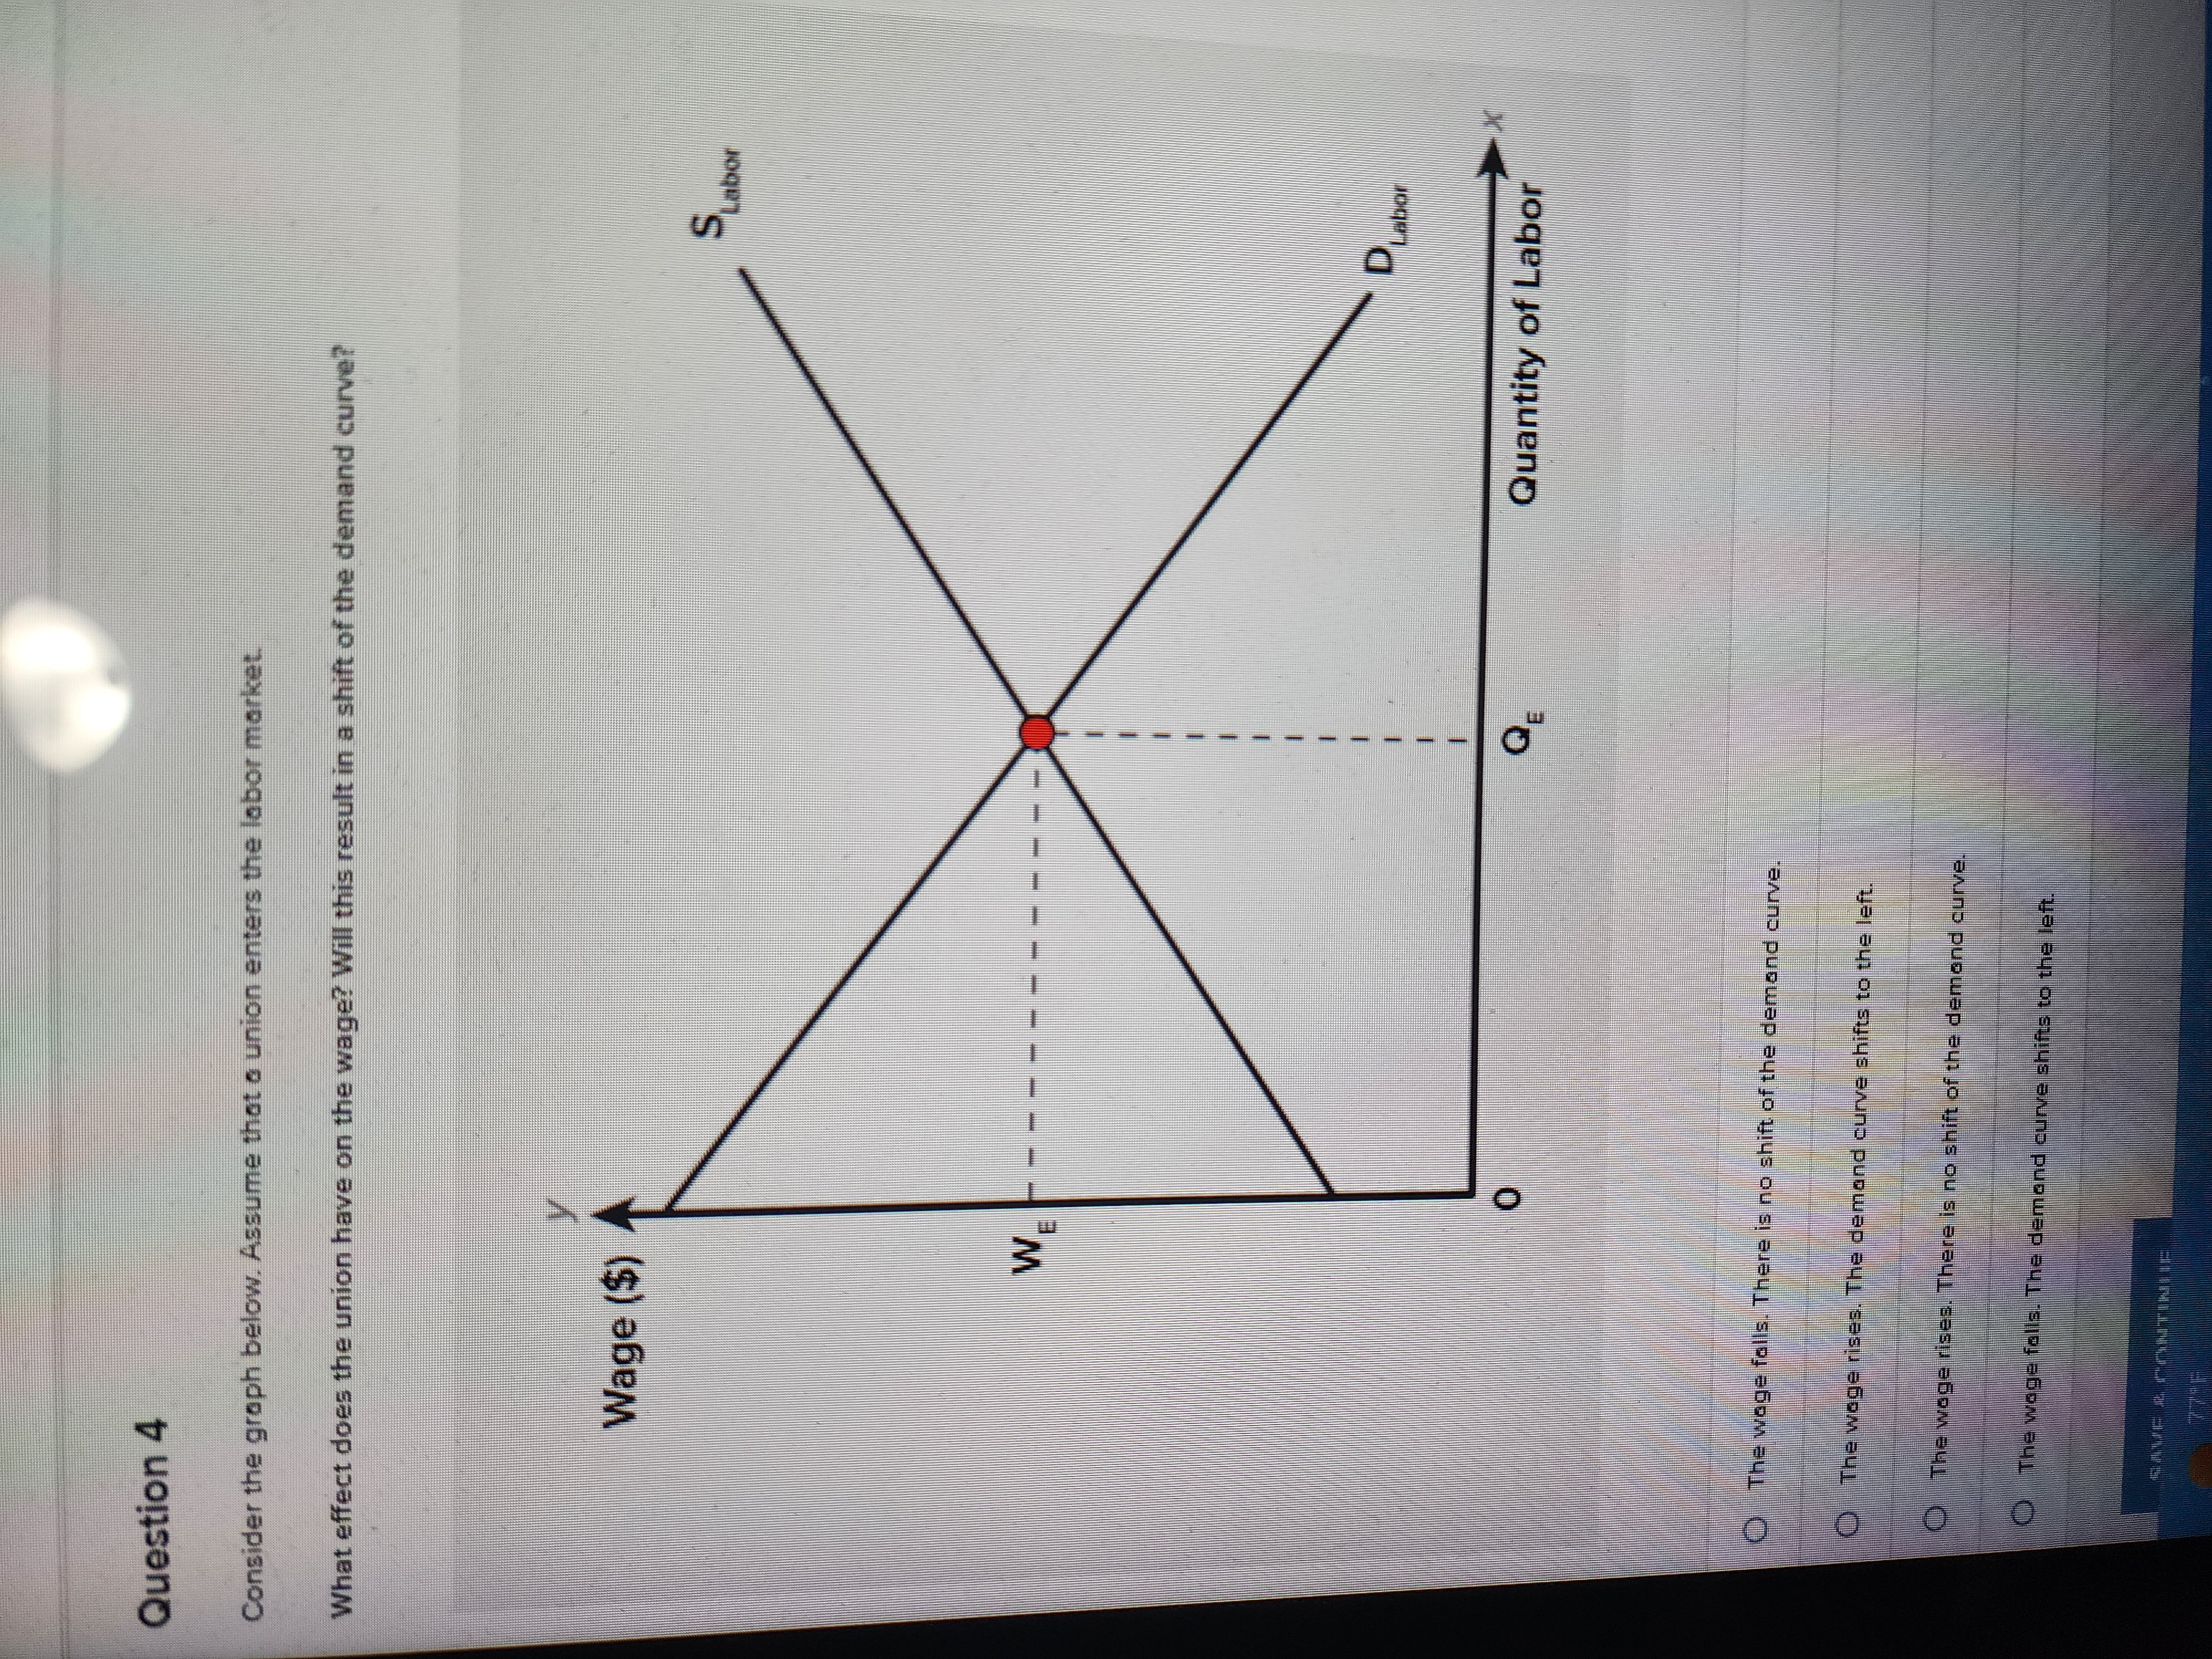
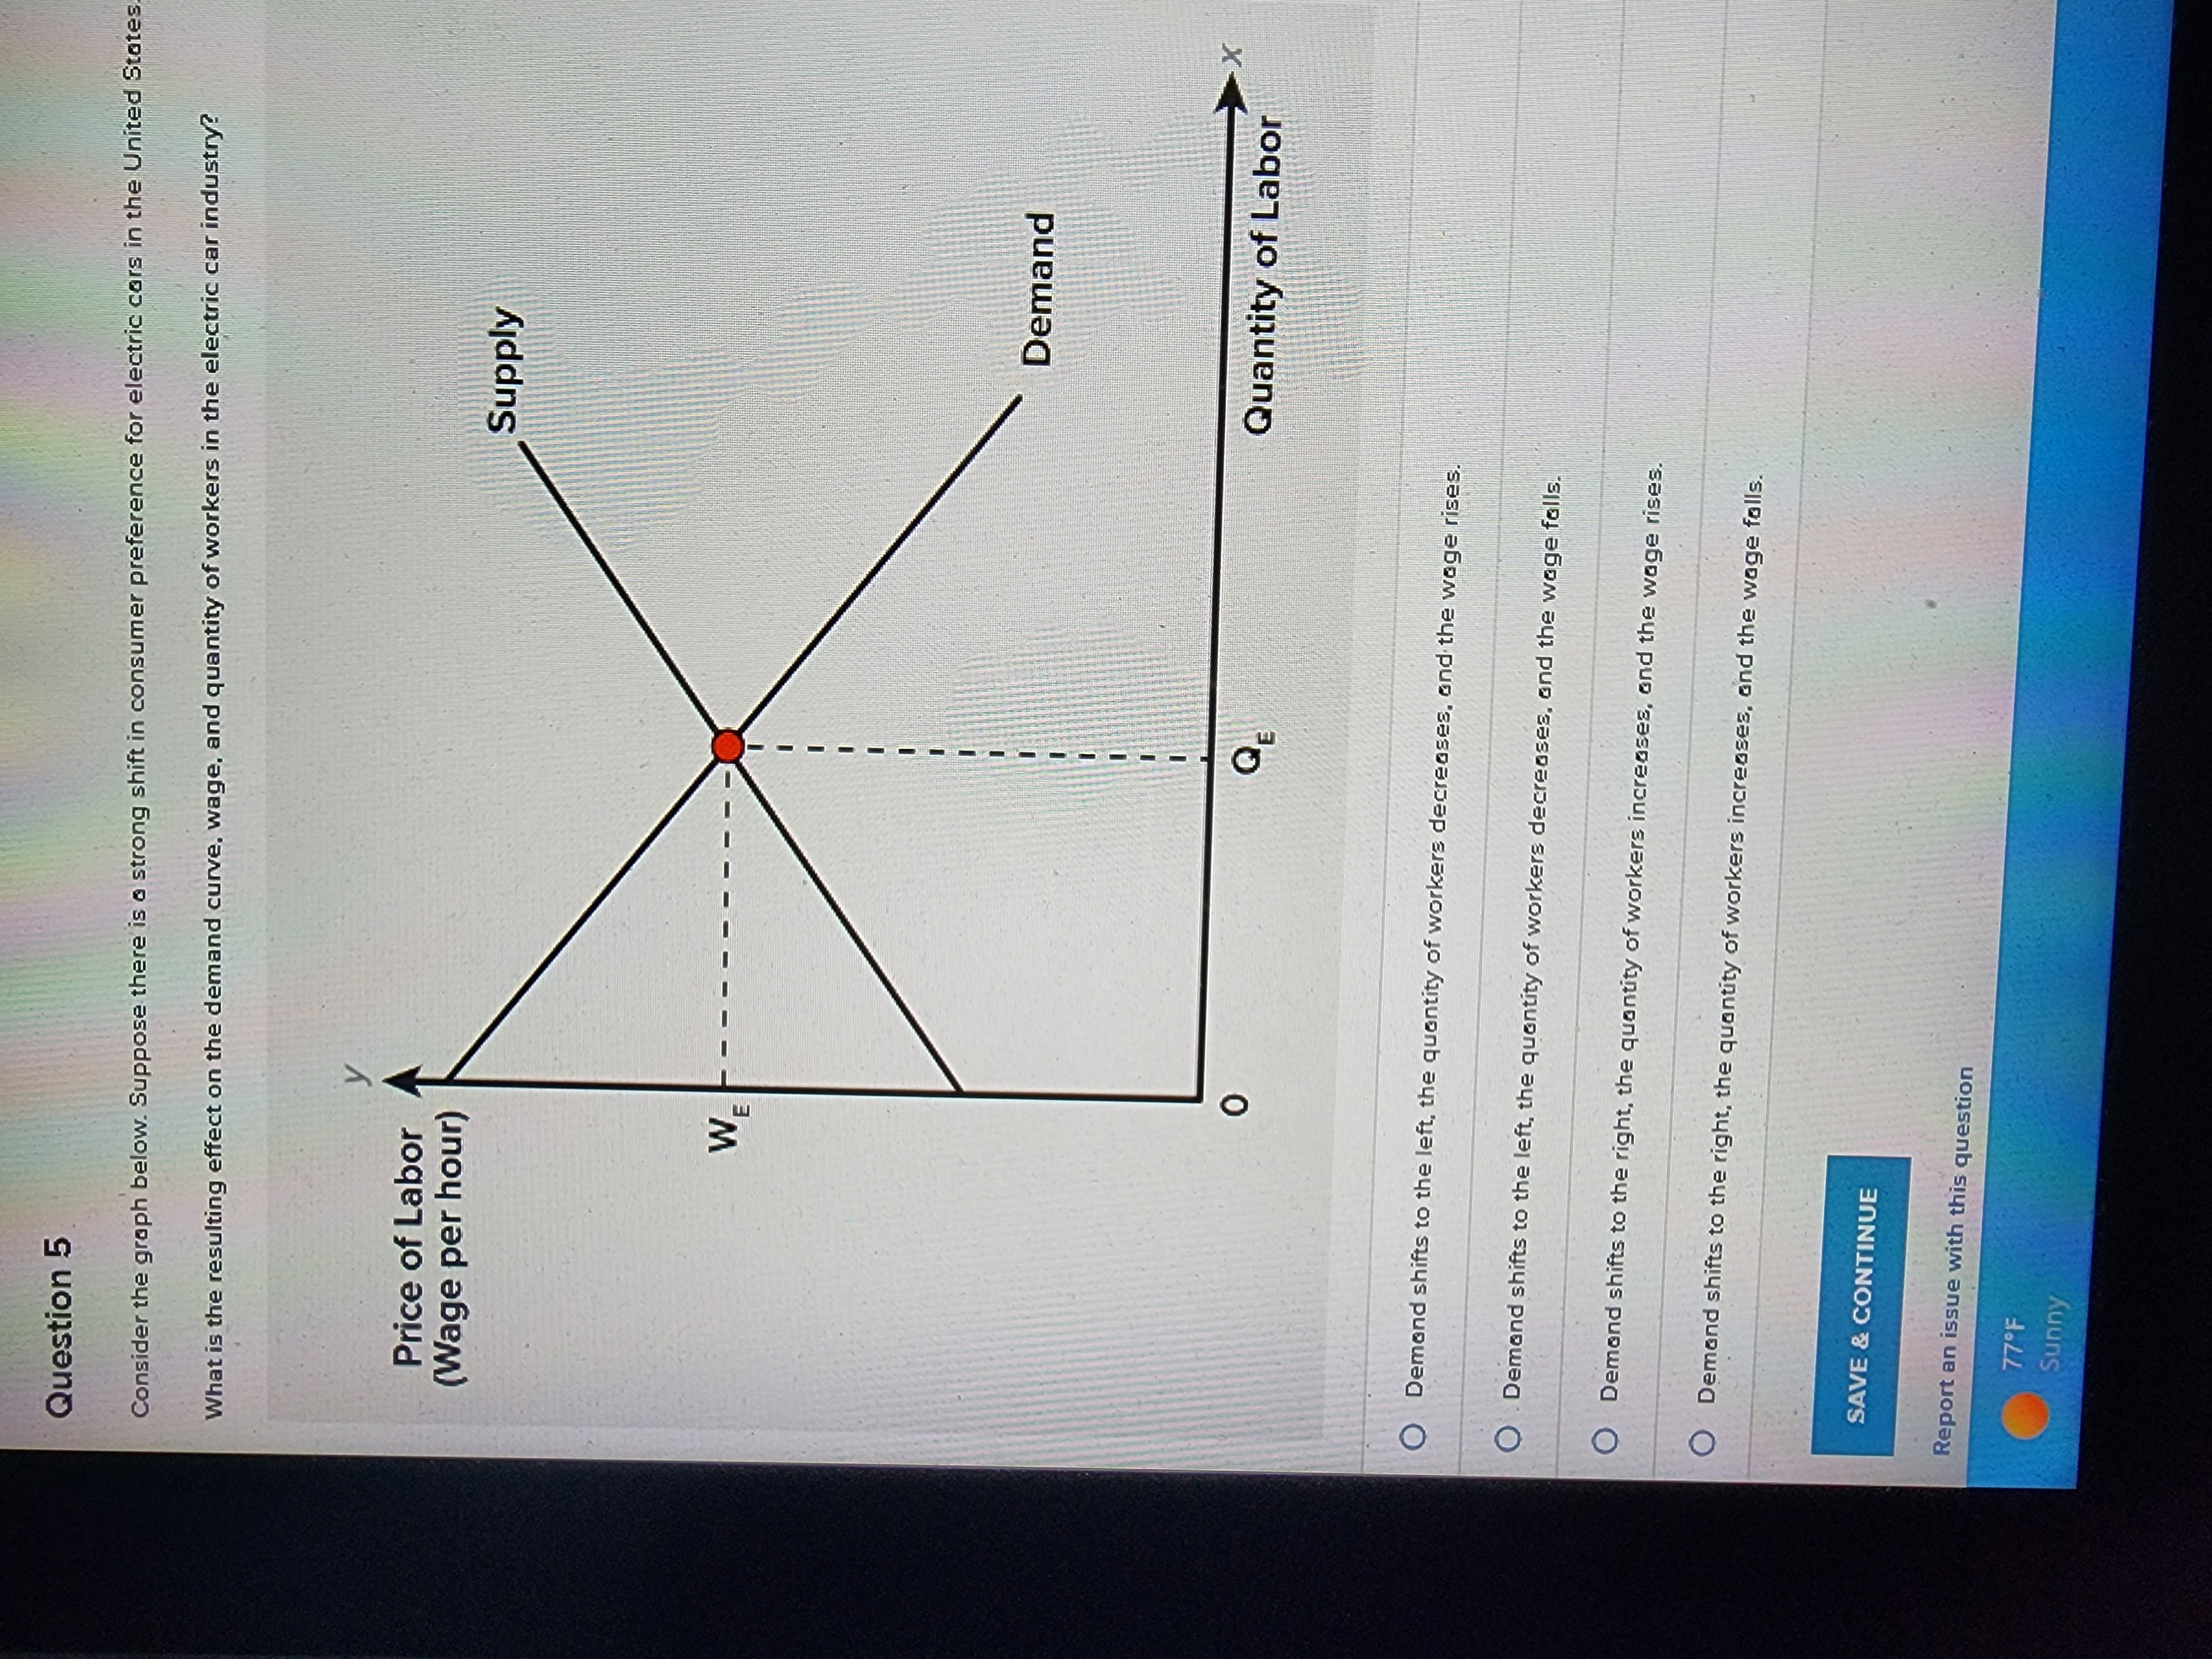
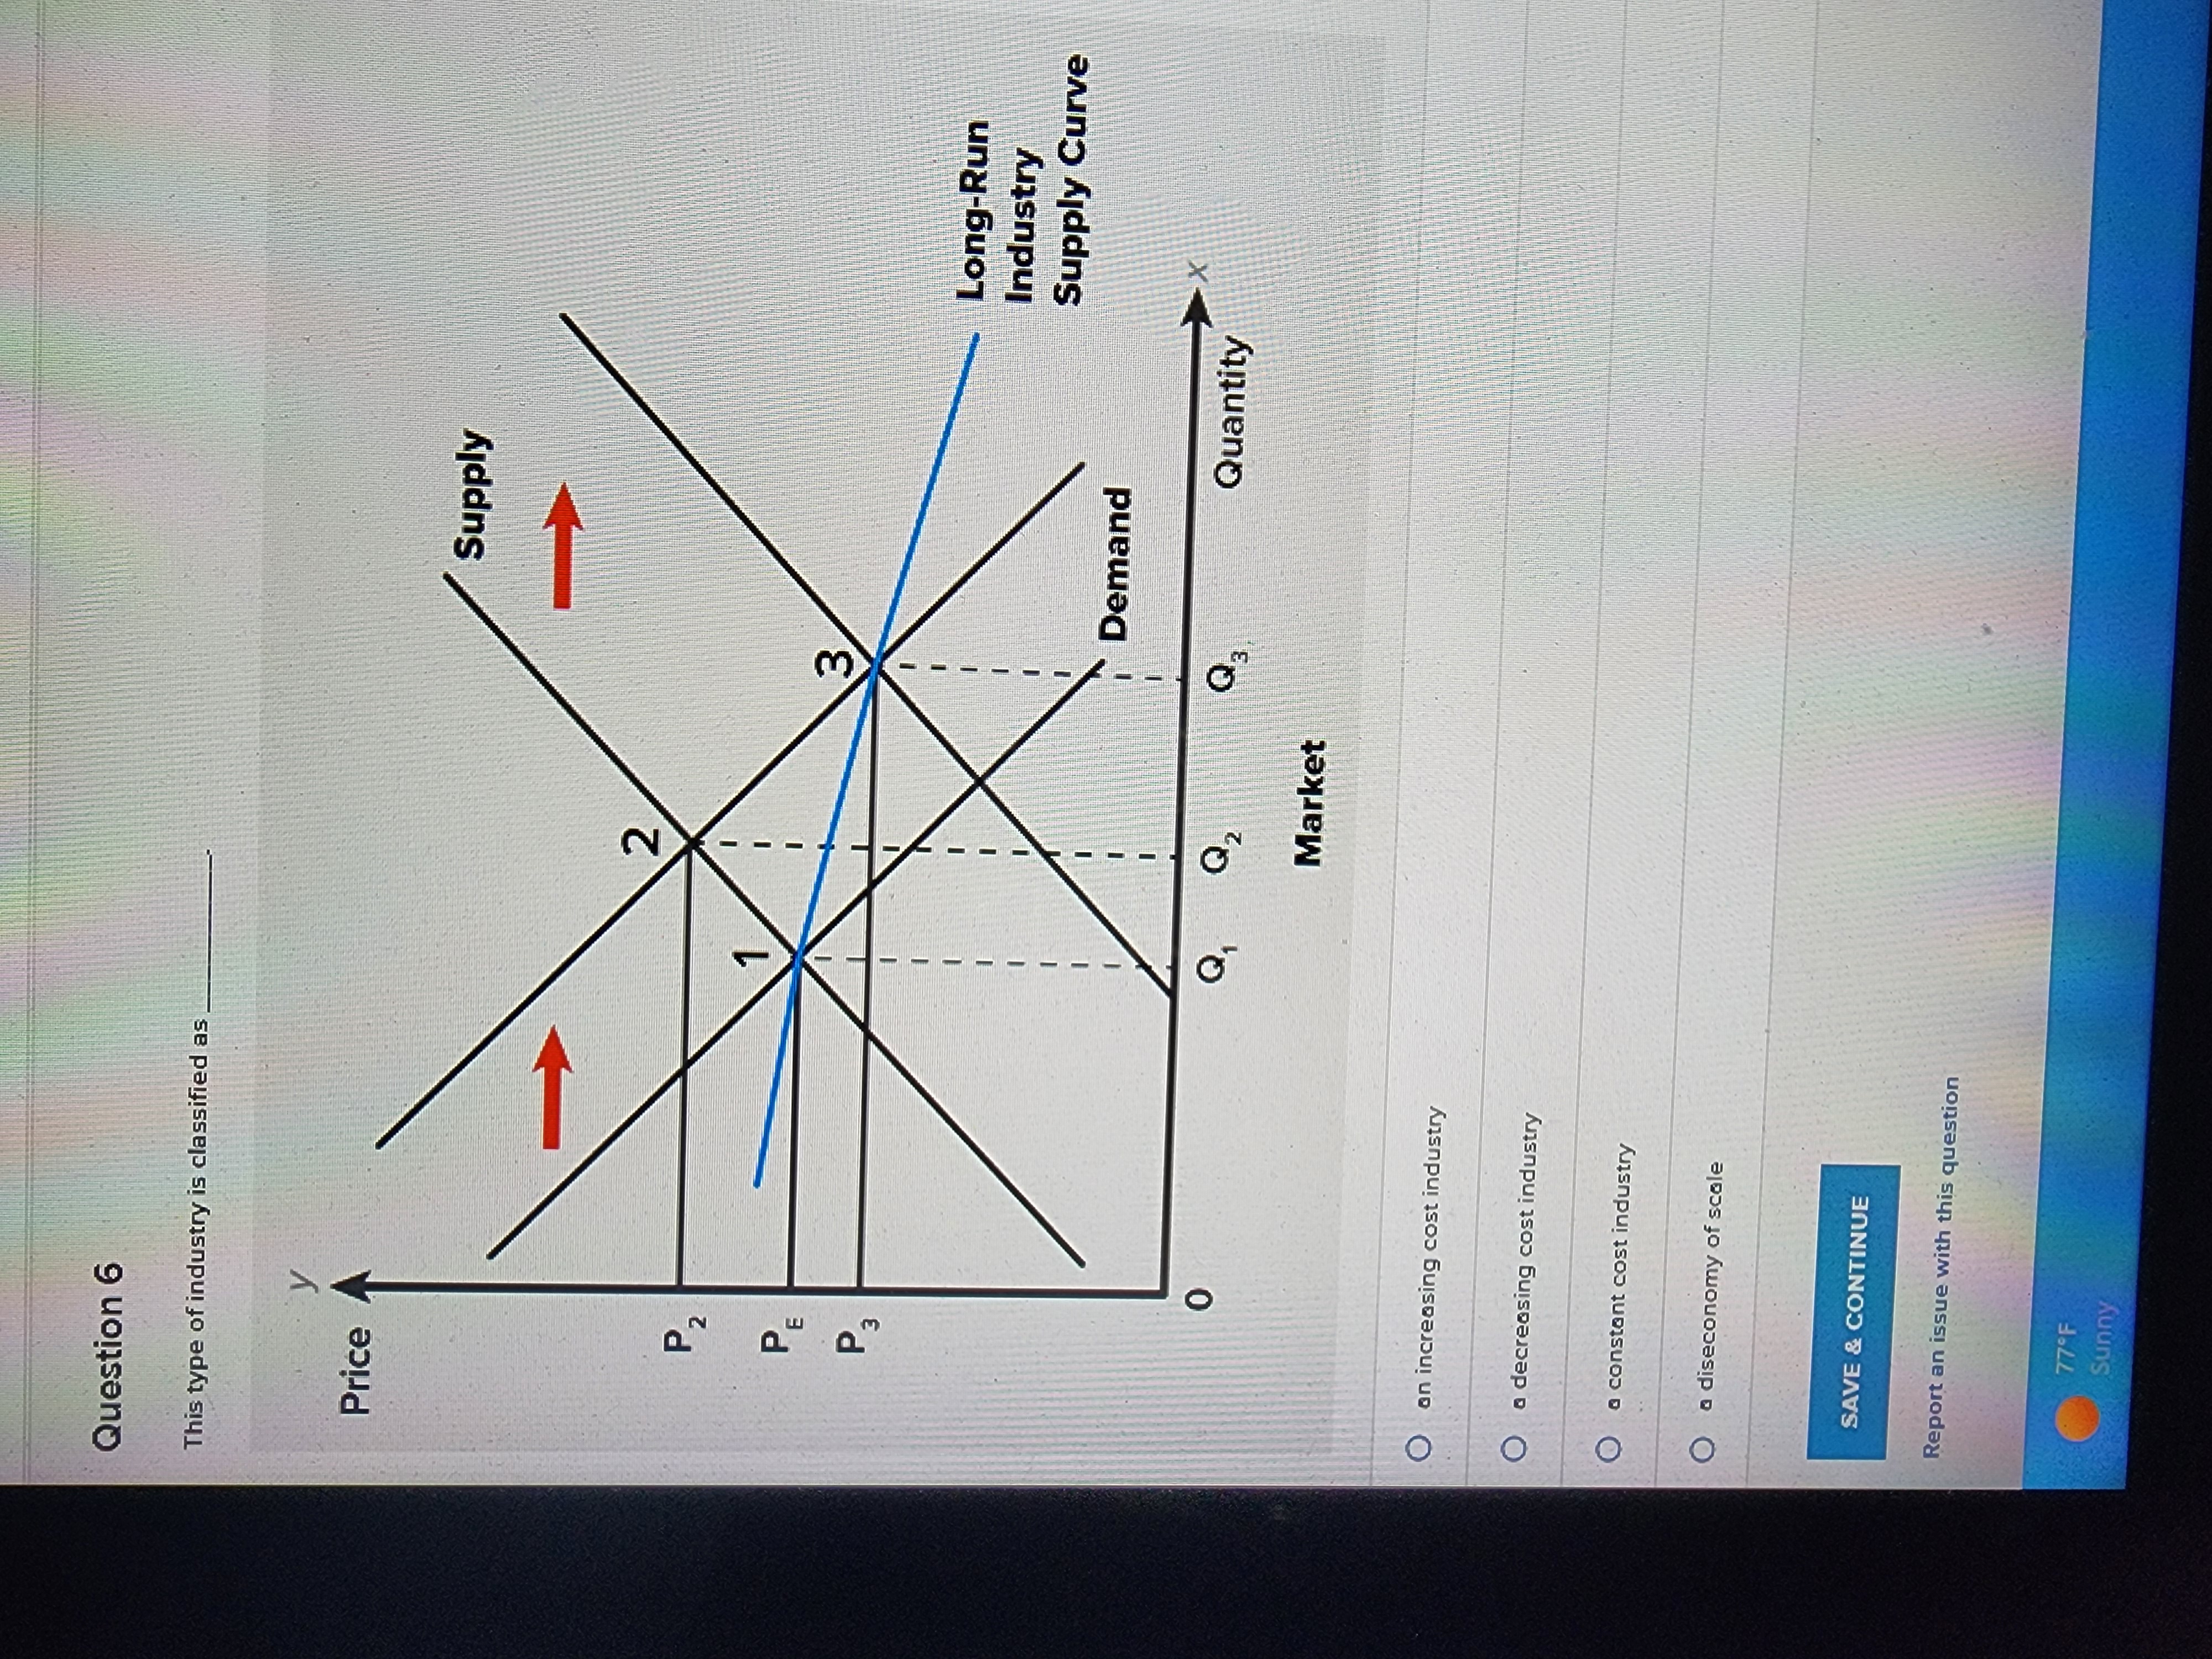


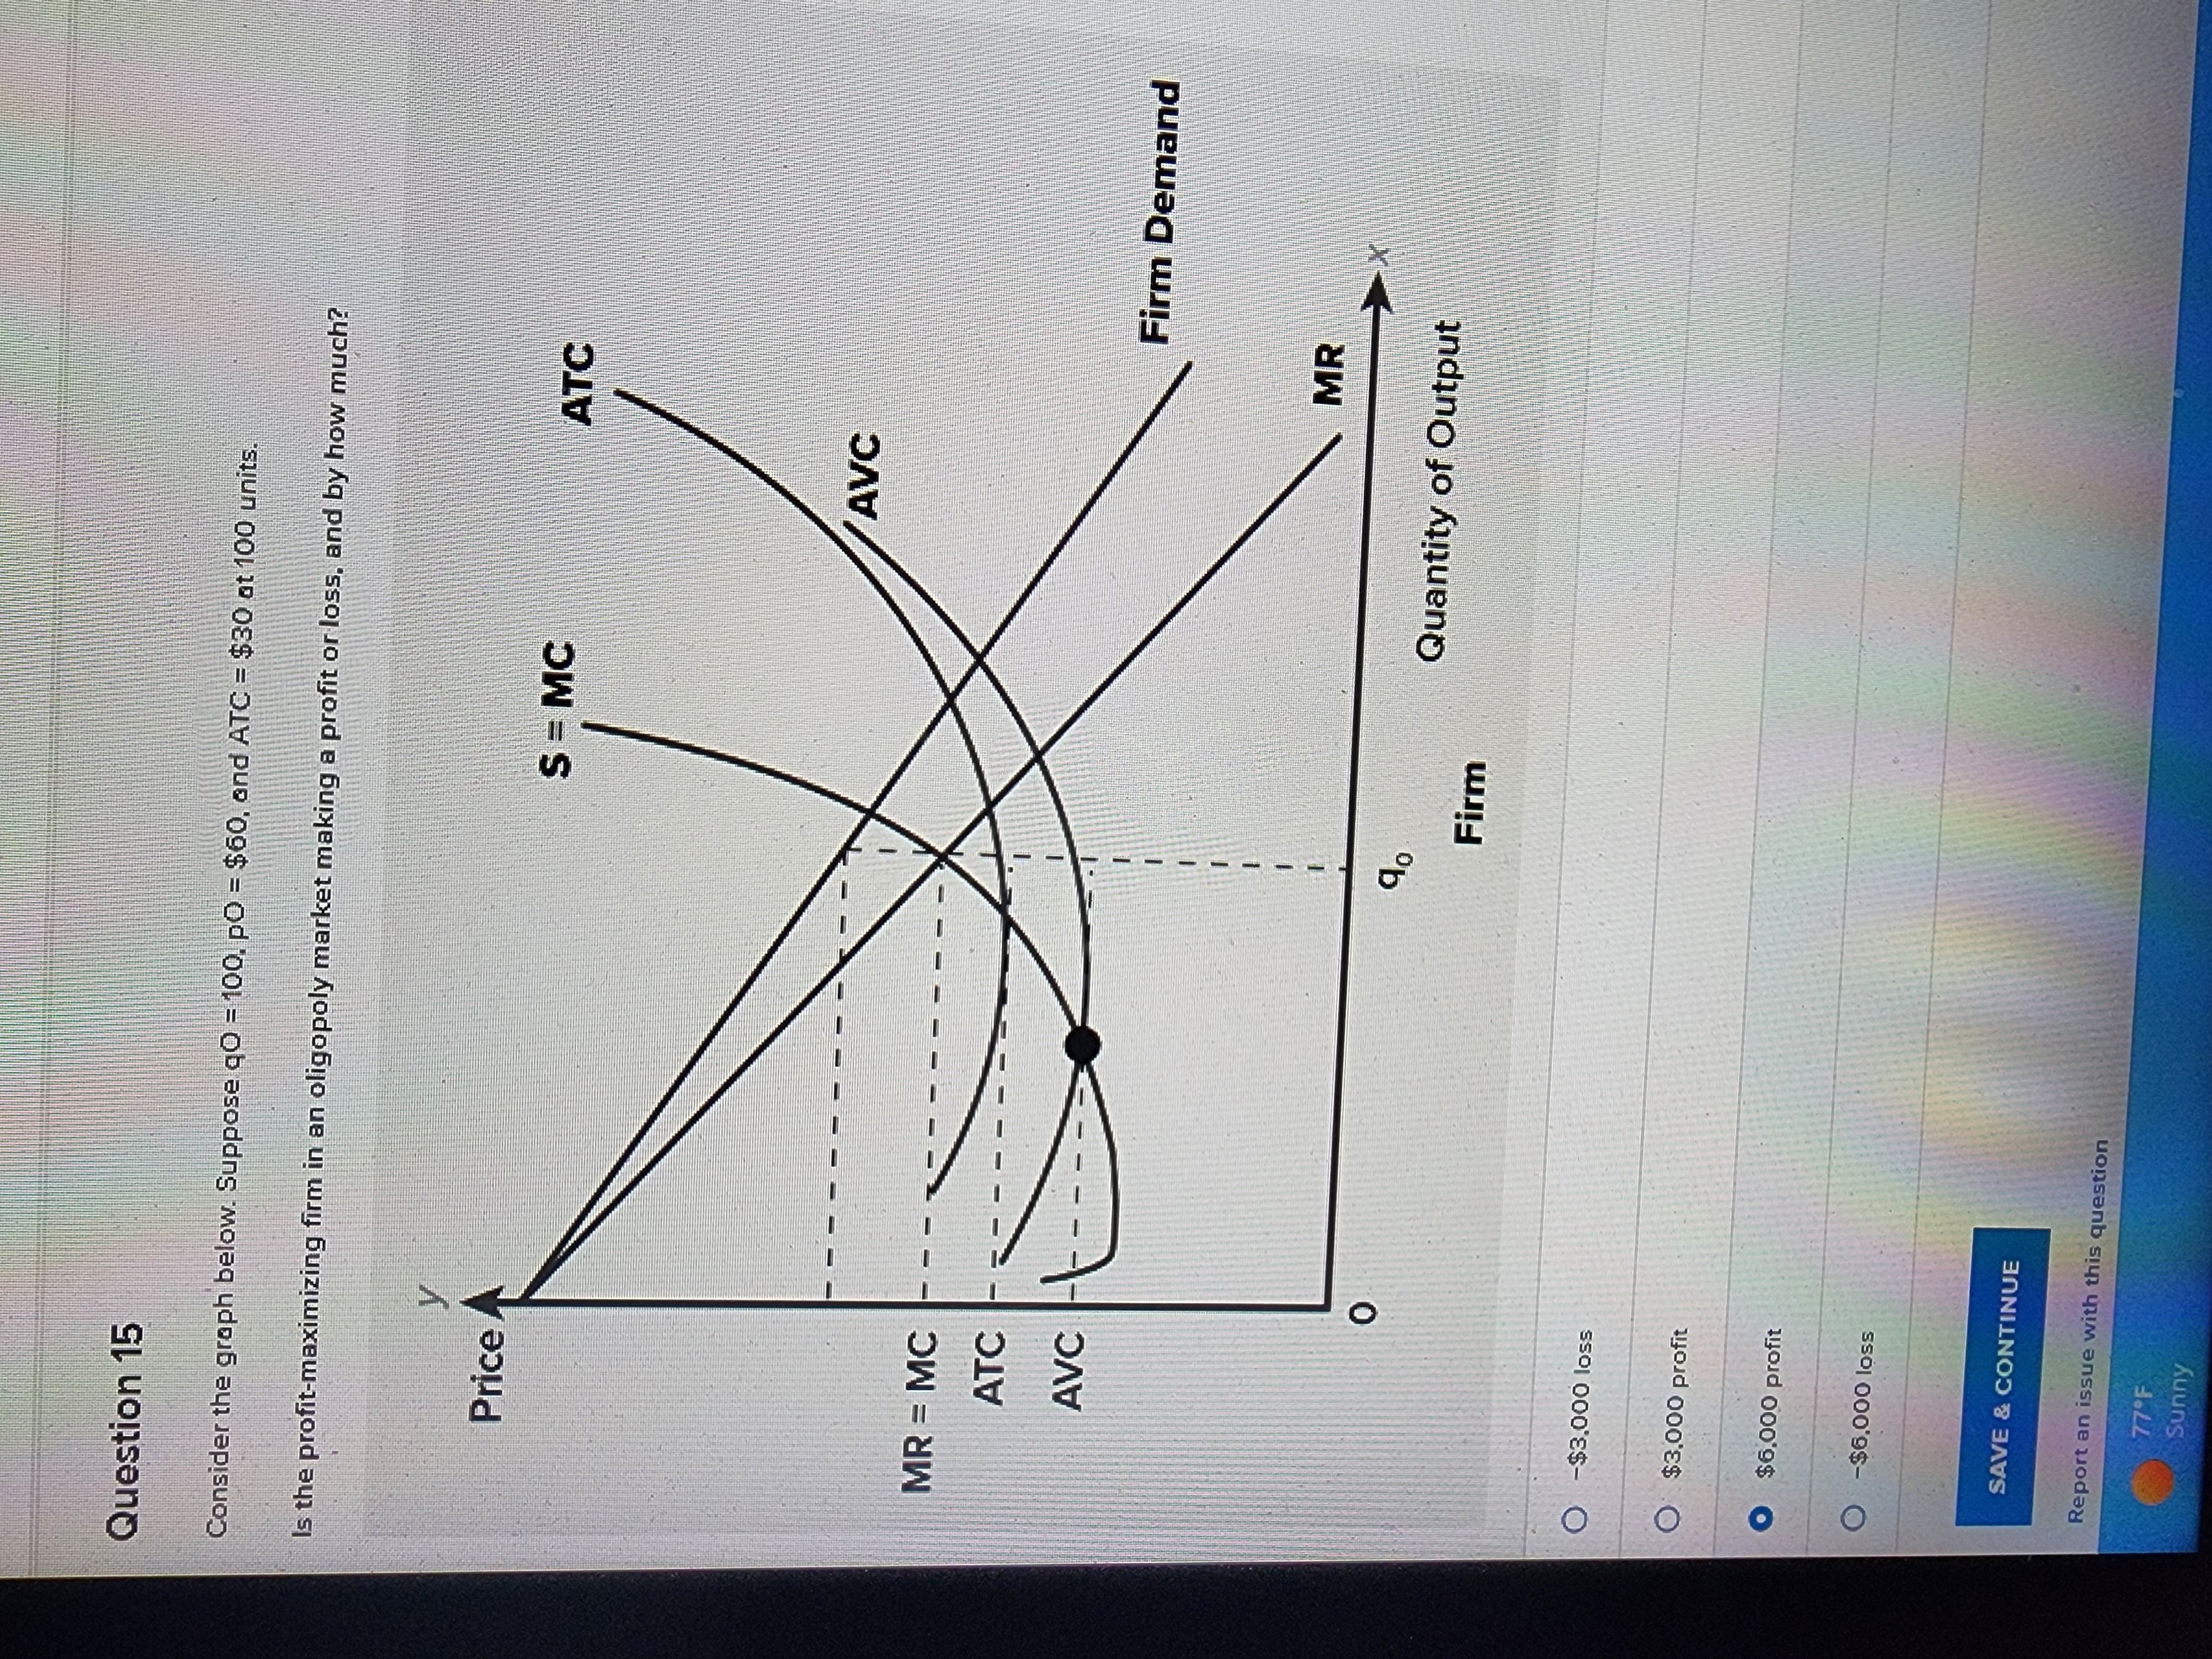

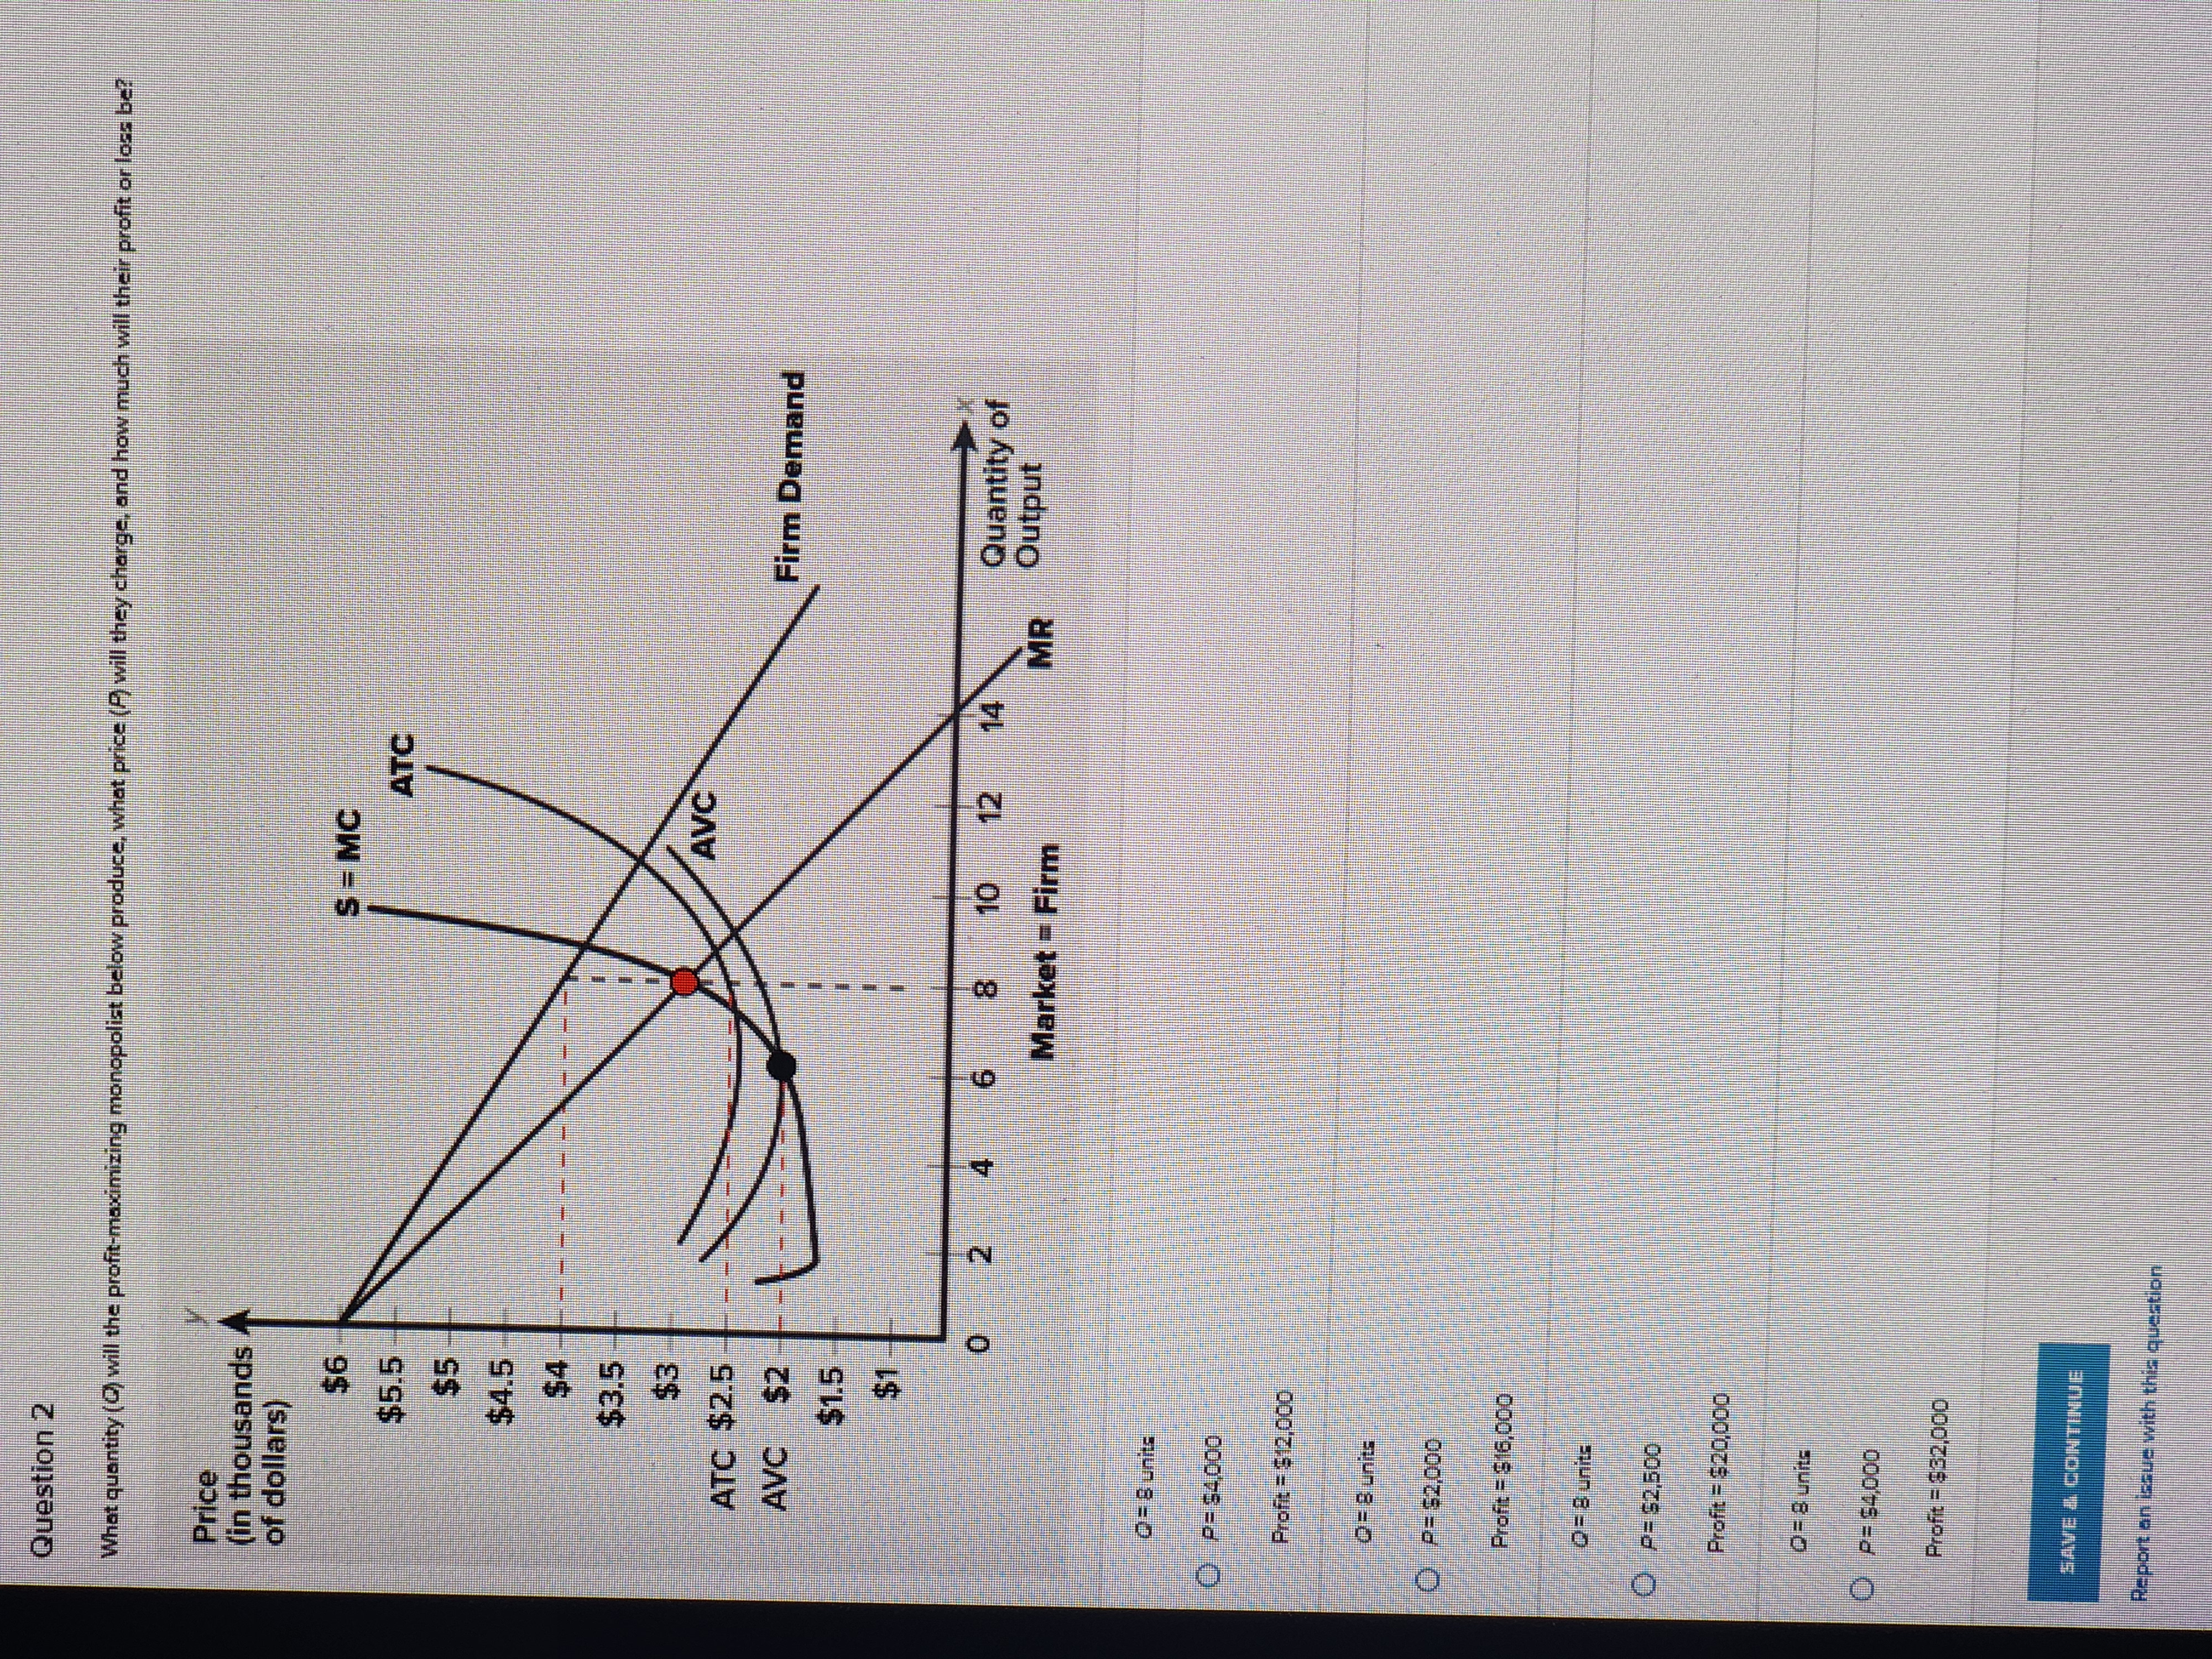
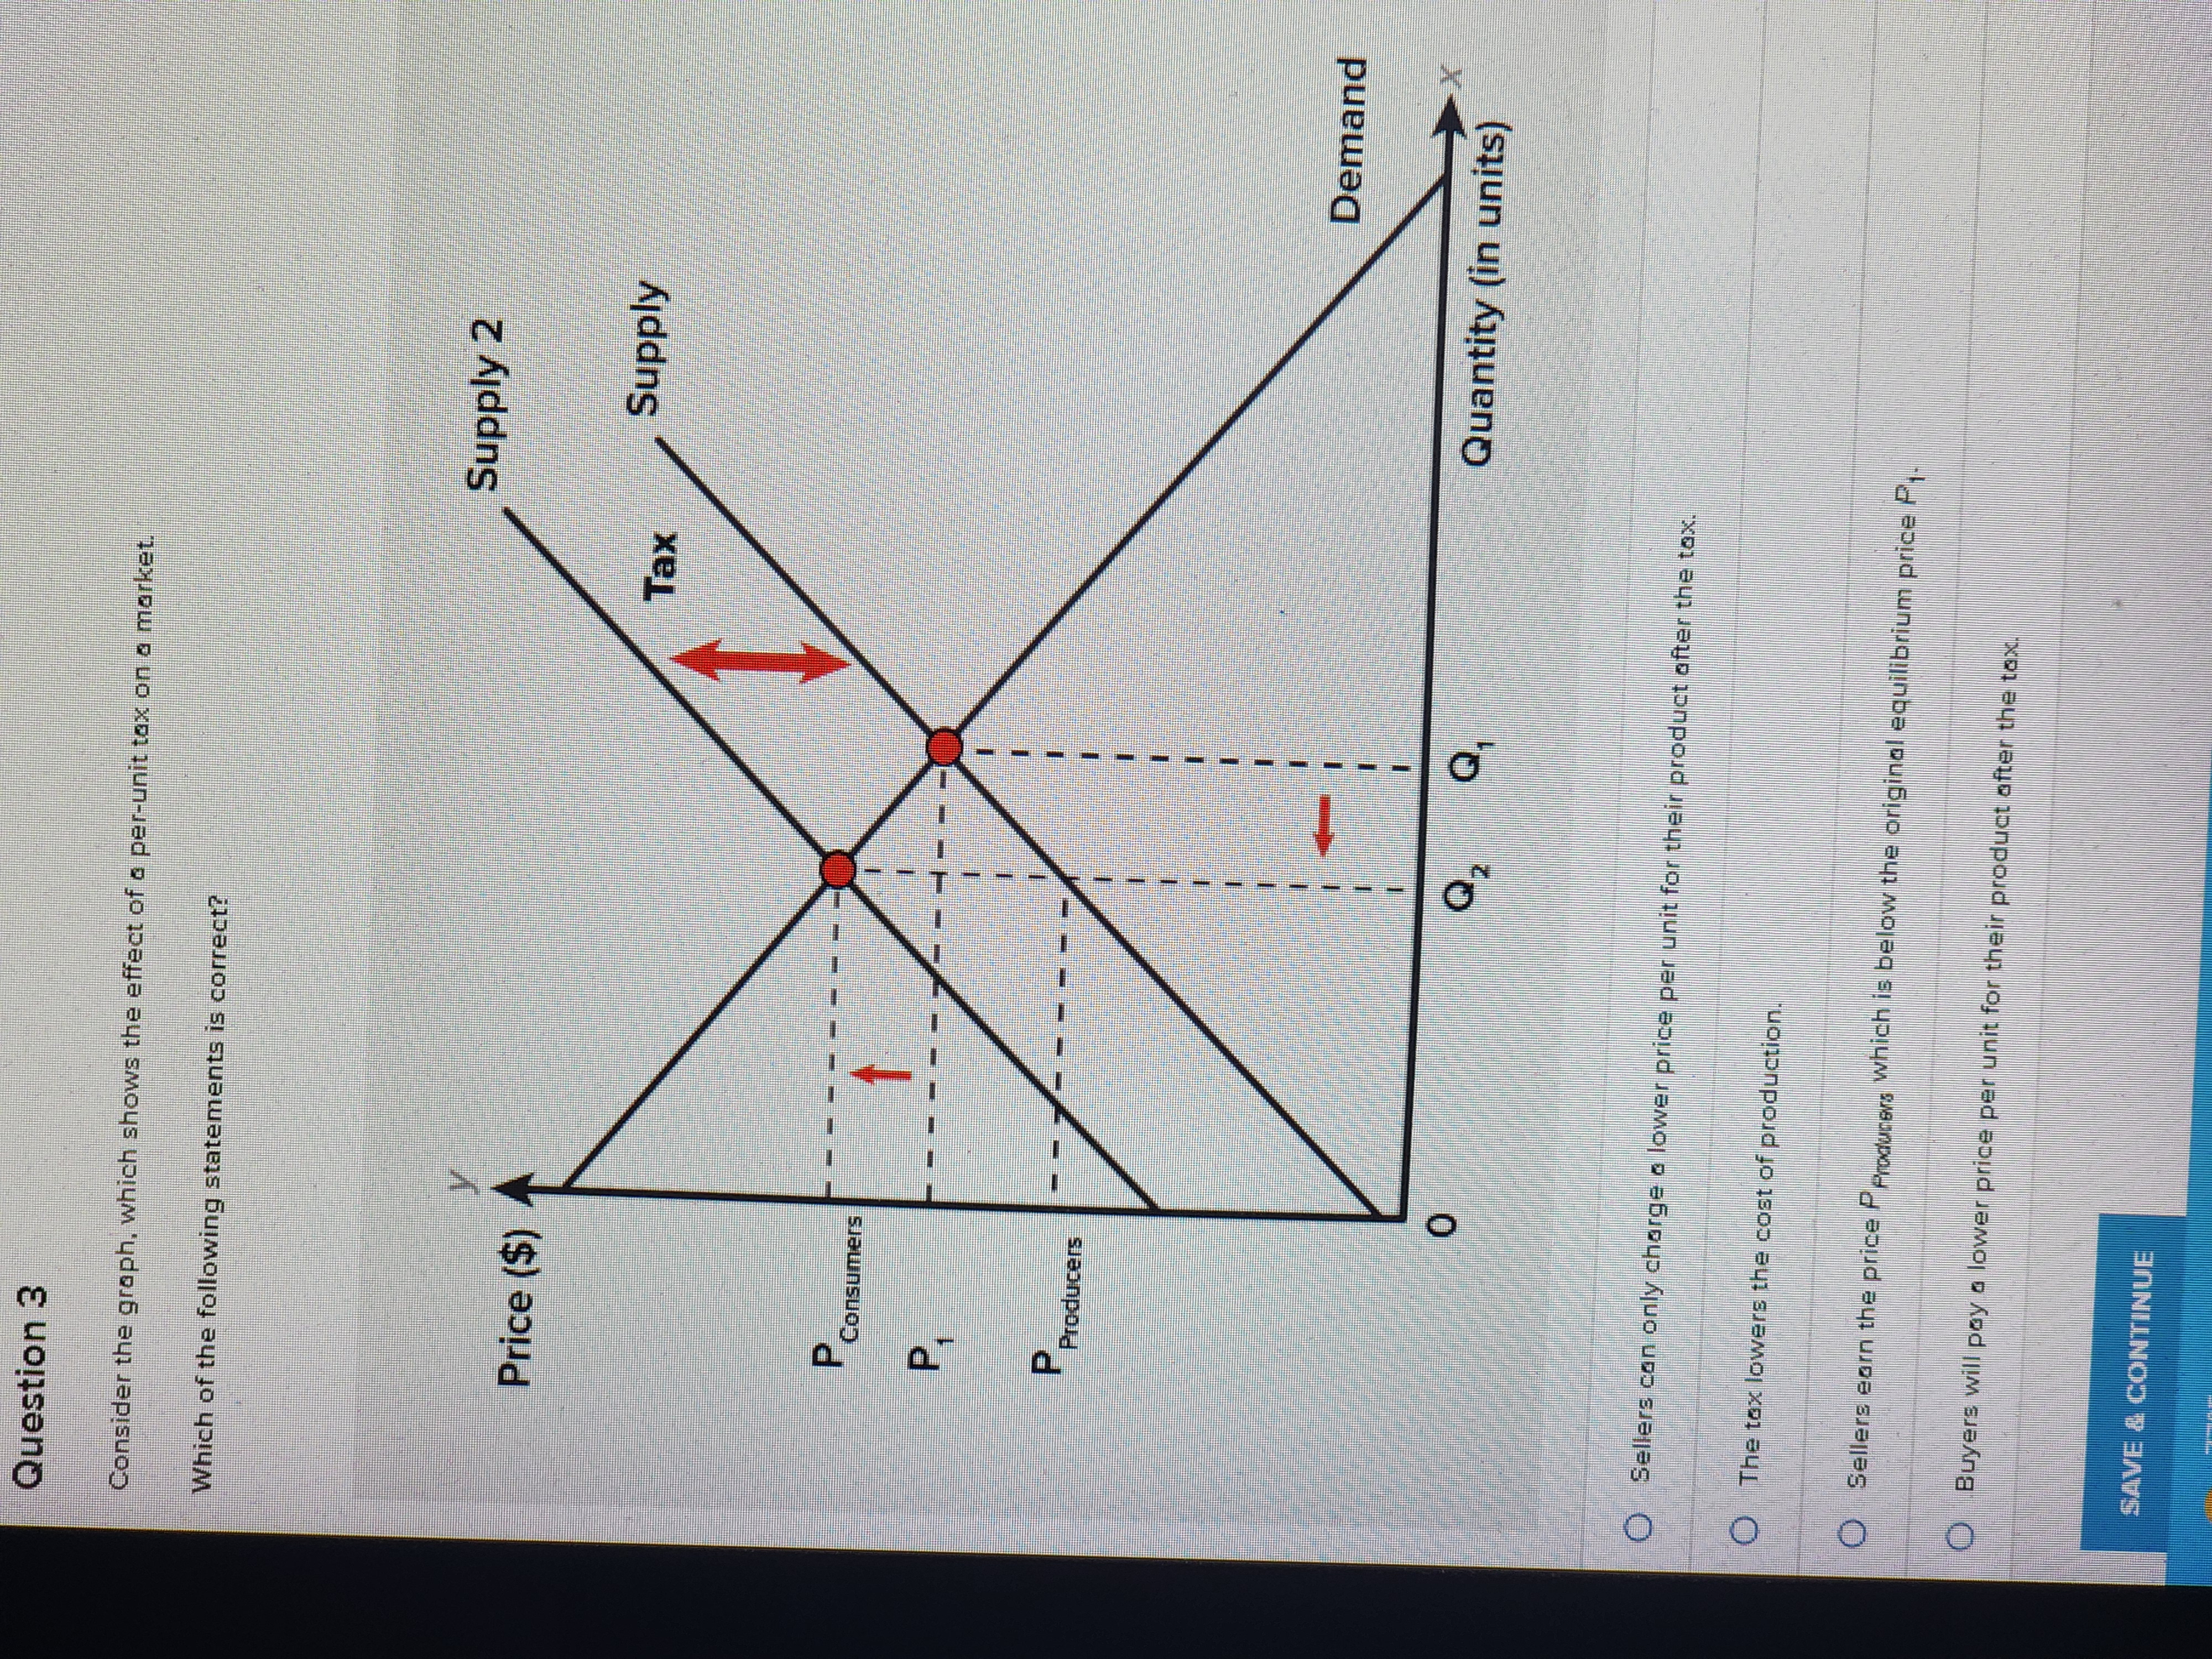


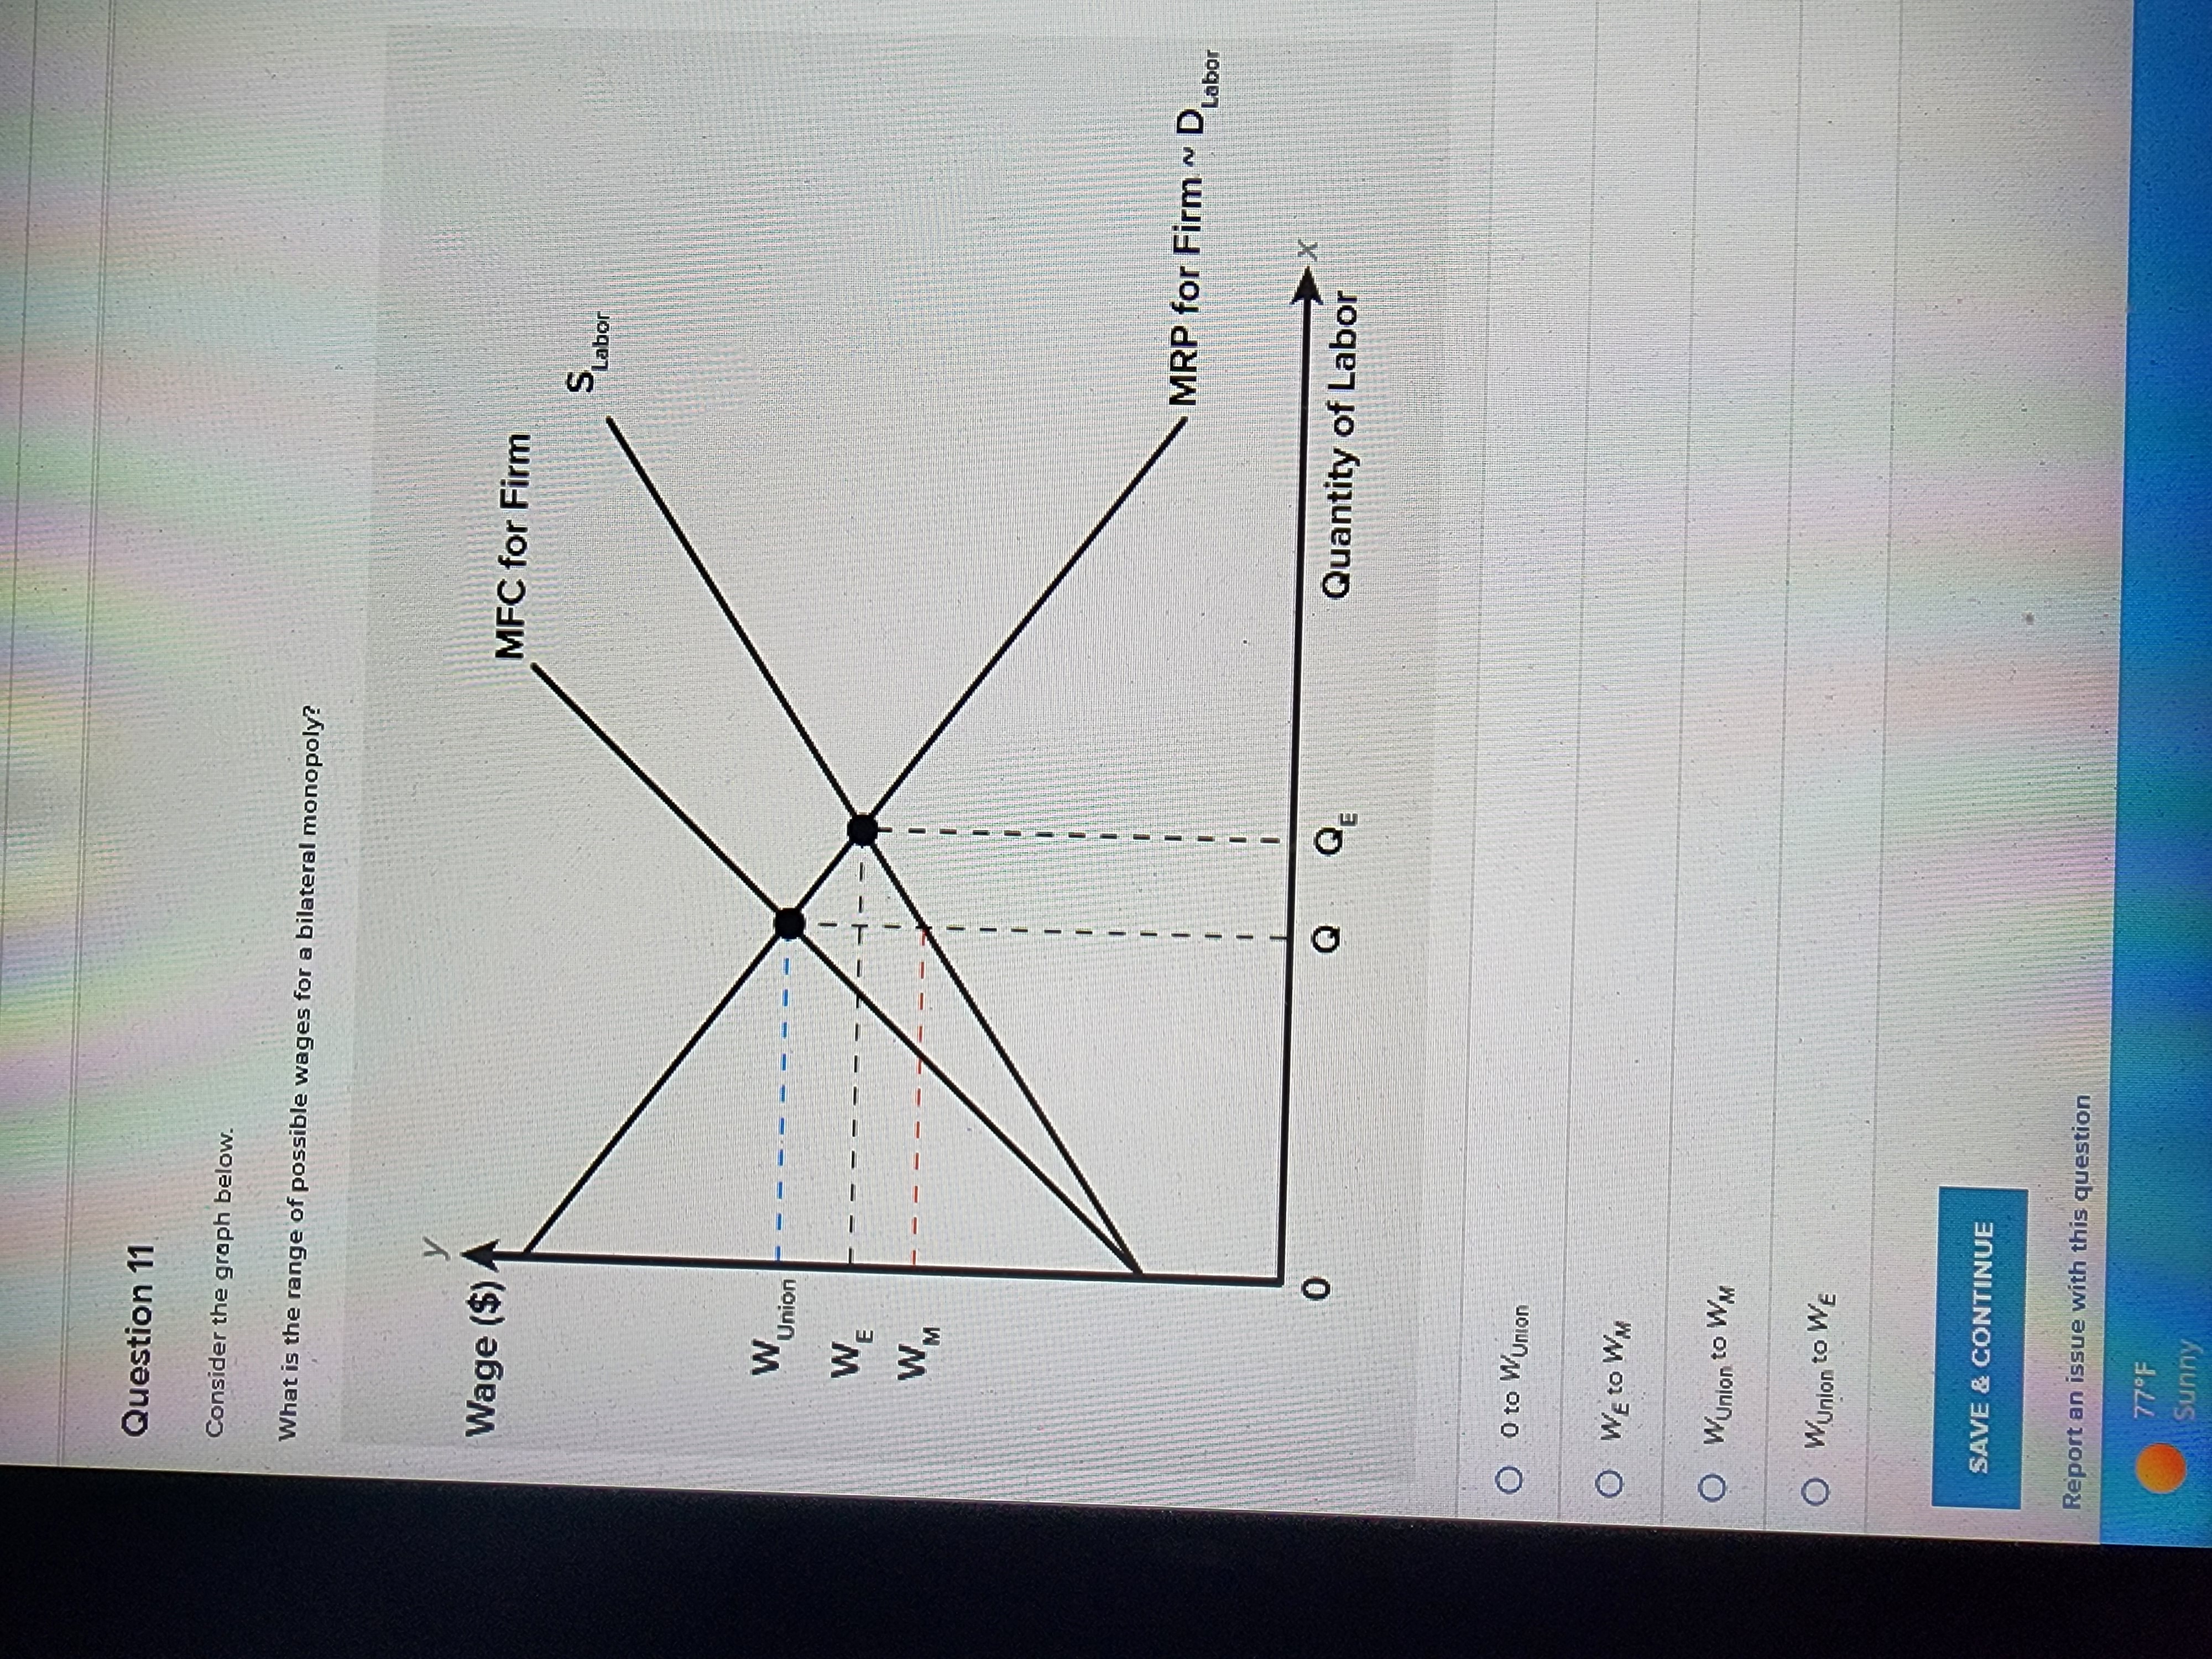
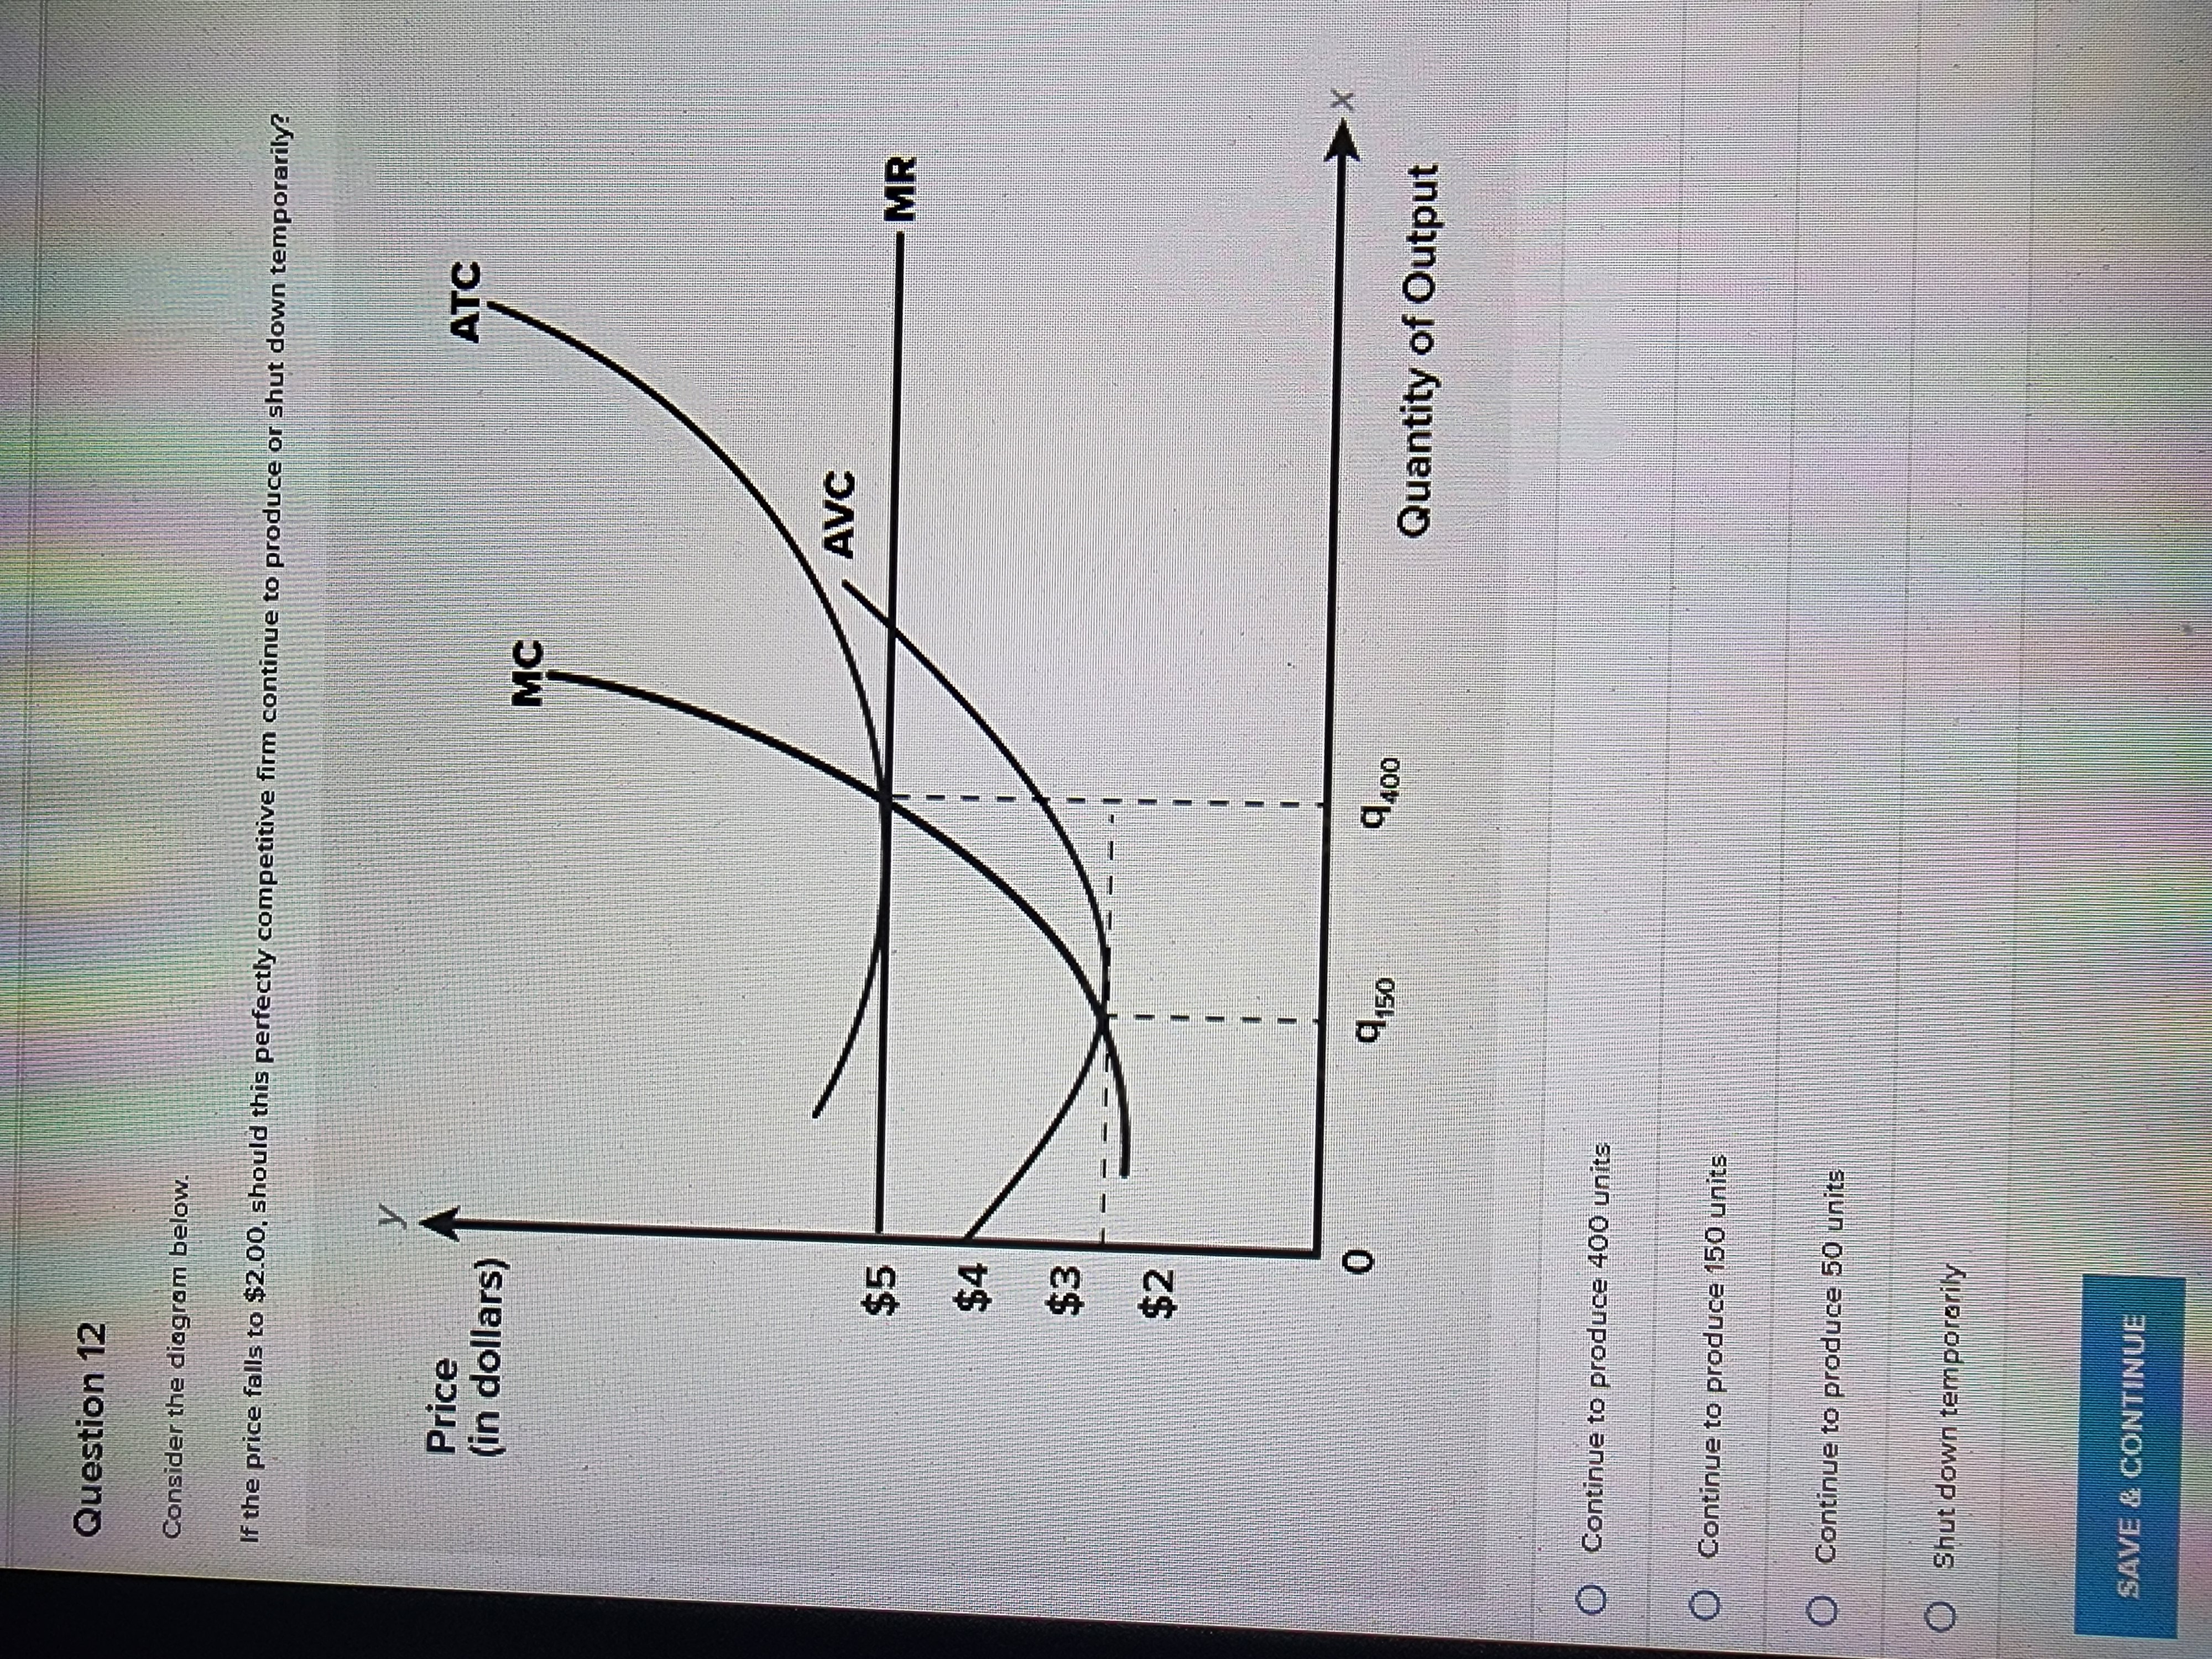
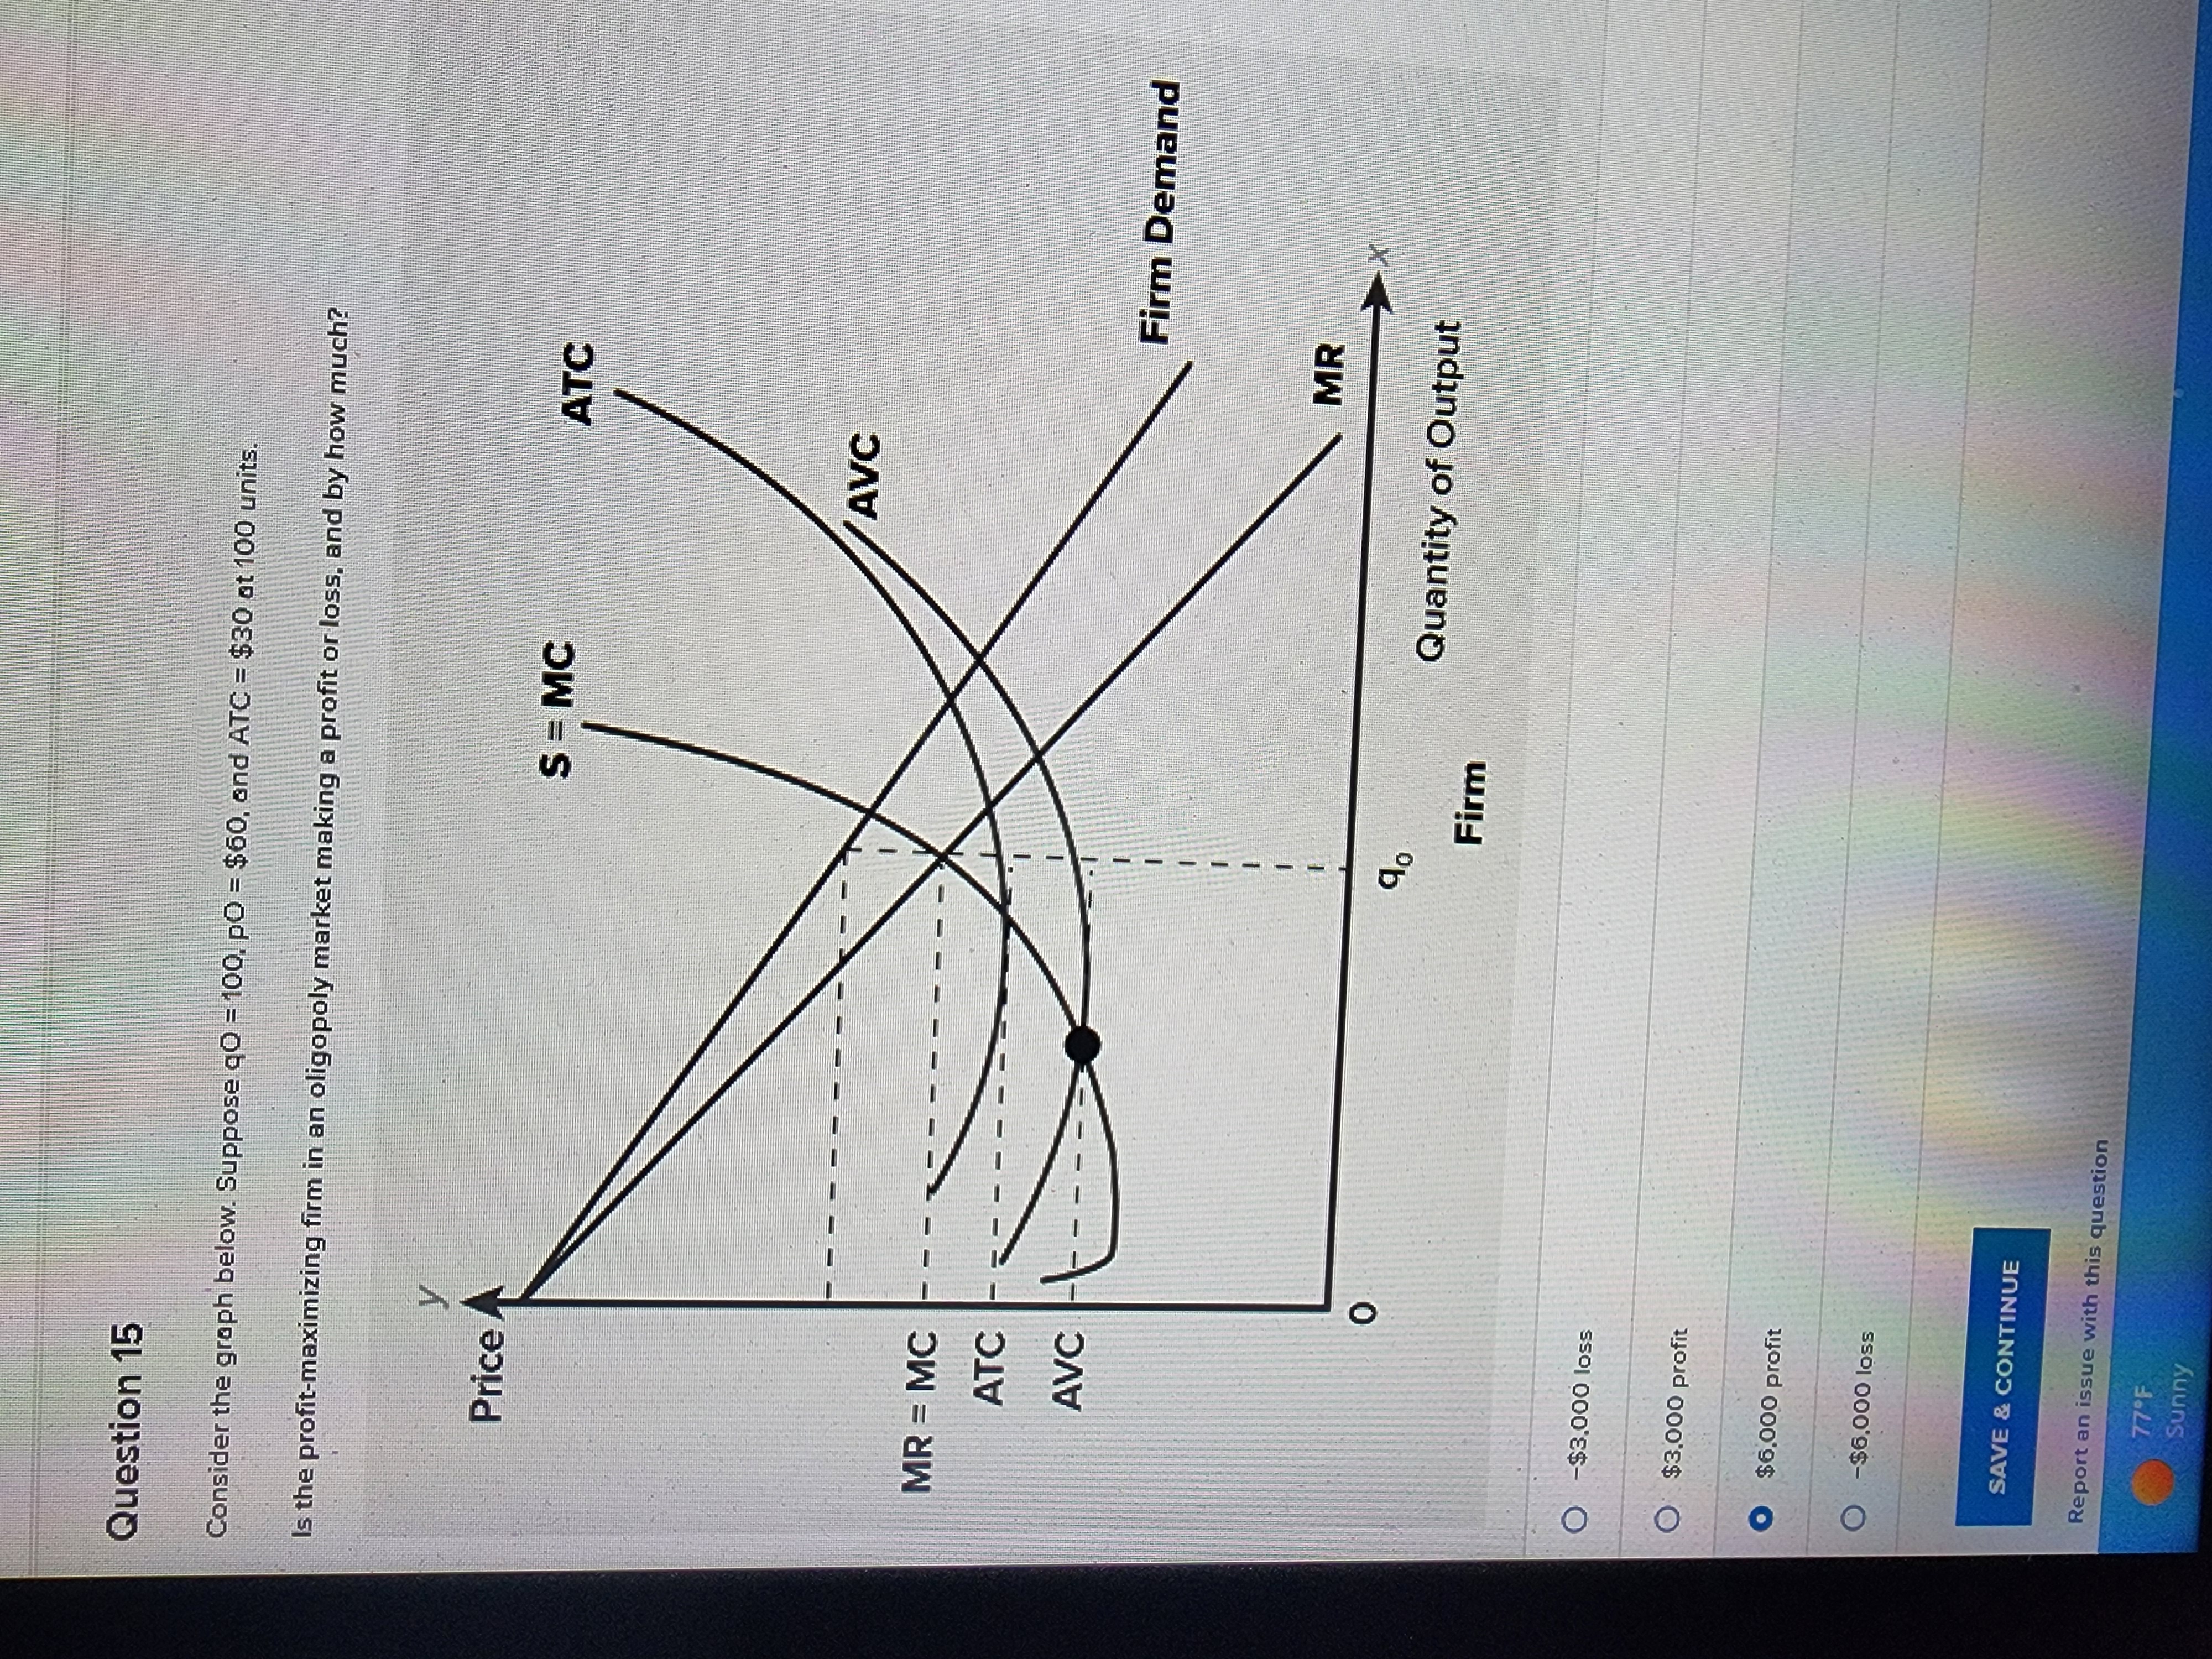
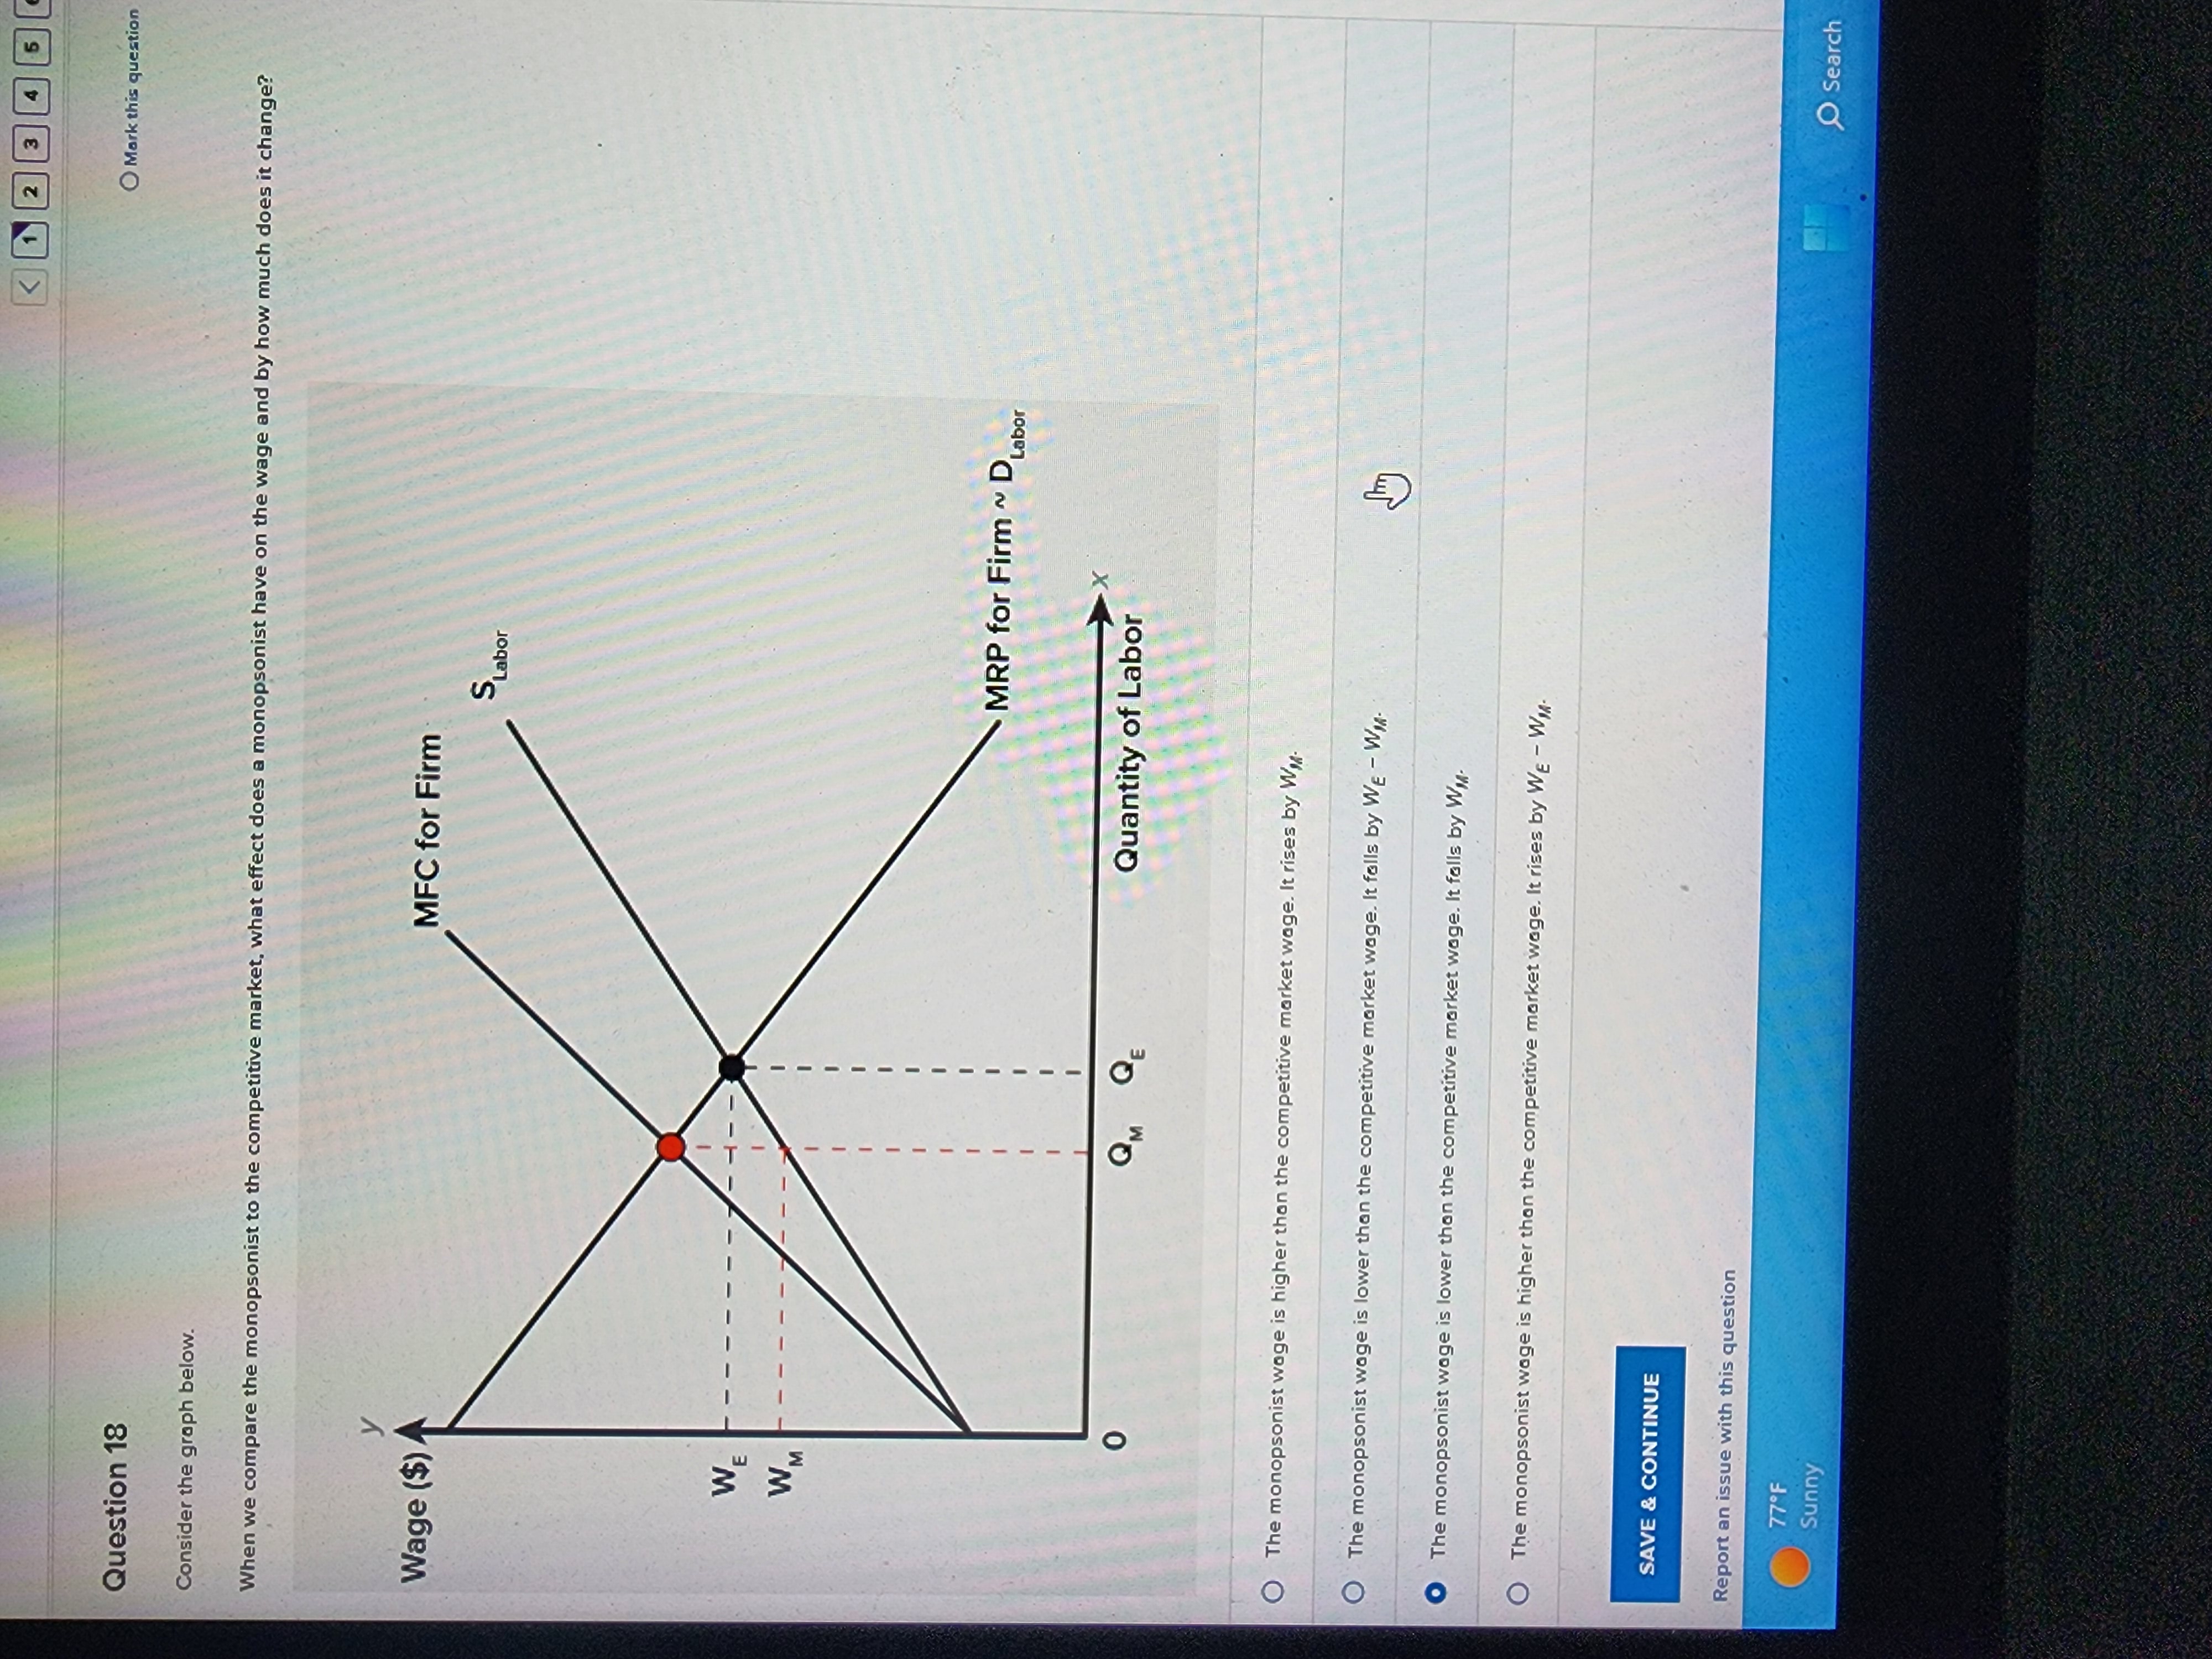
Question 2 What quantity (@) will the profit-maximizing (P) will they charge, and how much will their profit or loss be? Price (in thousands of dollars) $6 6- MC $5.5 ATC $5 $4.5 $4 $3.5 $3 AVC ATC $2.5 AVC $2 Firm Demand $1.5 8 10 12 Quantity of Market = Firm MR Output Profit = 316,000 0= 3 unite O P= $2.500 Profit = $20,000 O= 8 unite O P= $4,000 Profit = $32.000 SAVE & CONTINUEQuestion 3 Consider the graph, which shows the effect of a per-unit tax on a market. Which of the following statements is correct? Supply 2 Price ($) Tax Supply Consumers P P Producers Demand Q, Q Quantity (in units) O Sellers can only charge a lower price per unit for their product after the tax. The tax lowers the cost of production. O Sellers earn the price Peroourers which is below the original equilibrium price F, Buyers will pay a lower price per unit for their product after the tox SAVE & CONTINUEQuestion 4 Consider the graph below. Assume that a union enters the labor market What effect does the union have on the wage? Will this result in a shift of the demand curve? Wage ($) SLabor W QE Quantity of Labor wage falls. is no shift of the demand curve. The wage ri curve shifts to the left it of the demand curve. O ve shifts to the left-Question 5 Consider the graph below. Suppose there is a strong shift in consumer preference for electric cars in the United States What is the resulting effect on the demand curve, wage, and quantity of workers in the electric car industry? Price of Labor A (Wage per hour) Supply WE Demand Quantity of Labor O Demand shifts to the left, the quantity of workers decreases. and the wage rises. `Demand shifts to the left, the quantity of workers decreases, and the wage falls. O Demand shifts to the right, the quantity of workers increases, and the wage rises. O Demand shifts to the right, the quantity of workers increases, and the wage falls. SAVE & CONTINUE Report an issue with this question 77F SunnyQuestion 6 This type of industry is classified as y Price Supply 3 Long-Run Industry Supply Curve Demand Q, Q, Q. Quantity Market O an increasing cost industry O a decreasing cost industry a constant cost industry a diseconomy of scale SAVE & CONTINUE Report an issue with this question 77.F SunnyQuestion 11 Consider the graph below. What is the range of possible wages for a bilateral monopoly? Wage ($) 4 MFC for Firm Labor Union WE WM MRP for Firm ~ Labor Quantity of Labor O o to Wunion O WE to WM O Wunion to WM O Wunion to WE SAVE & CONTINUE Report an issue with this question 77OF SunnyQuestion 12 Consider the diagram below. If the price falls to $2.00, should this perfectly competitive firm continue to produce or shut down temporarily? Price ATC (in dollars) MC AVC $5 MR $4 $3 $2 0 9150 9400 Quantity of Output O Continue to produce 400 units Continue to produce 150 units Continue to produce 50 units Shut down temporarily SAVE & CONTINUEQuestion 15 Consider the graph below. Suppose q0 = 100. pO = $60, and ATC = $30 at 100 units. Is the profit-maximizing firm in an oligopoly market making a profit or loss, and by how much? Price A S = MC ATC AVC MR = MC ATC AVC Firm Demand MR Quantity of Output Firm O -$3.000 loss $3.000 profit . $6.000 profit O -$6,000 loss SAVE & CONTINUE Report an issue with this question Sunny
Step by Step Solution
There are 3 Steps involved in it

Get step-by-step solutions from verified subject matter experts