

Question: Question 20 Use the data from the attached chart to calculate MSFT's net profit for FY2022. Microsoft (MSFT) FY2022 Revenue: $198.3B Cost of Goods Sold:
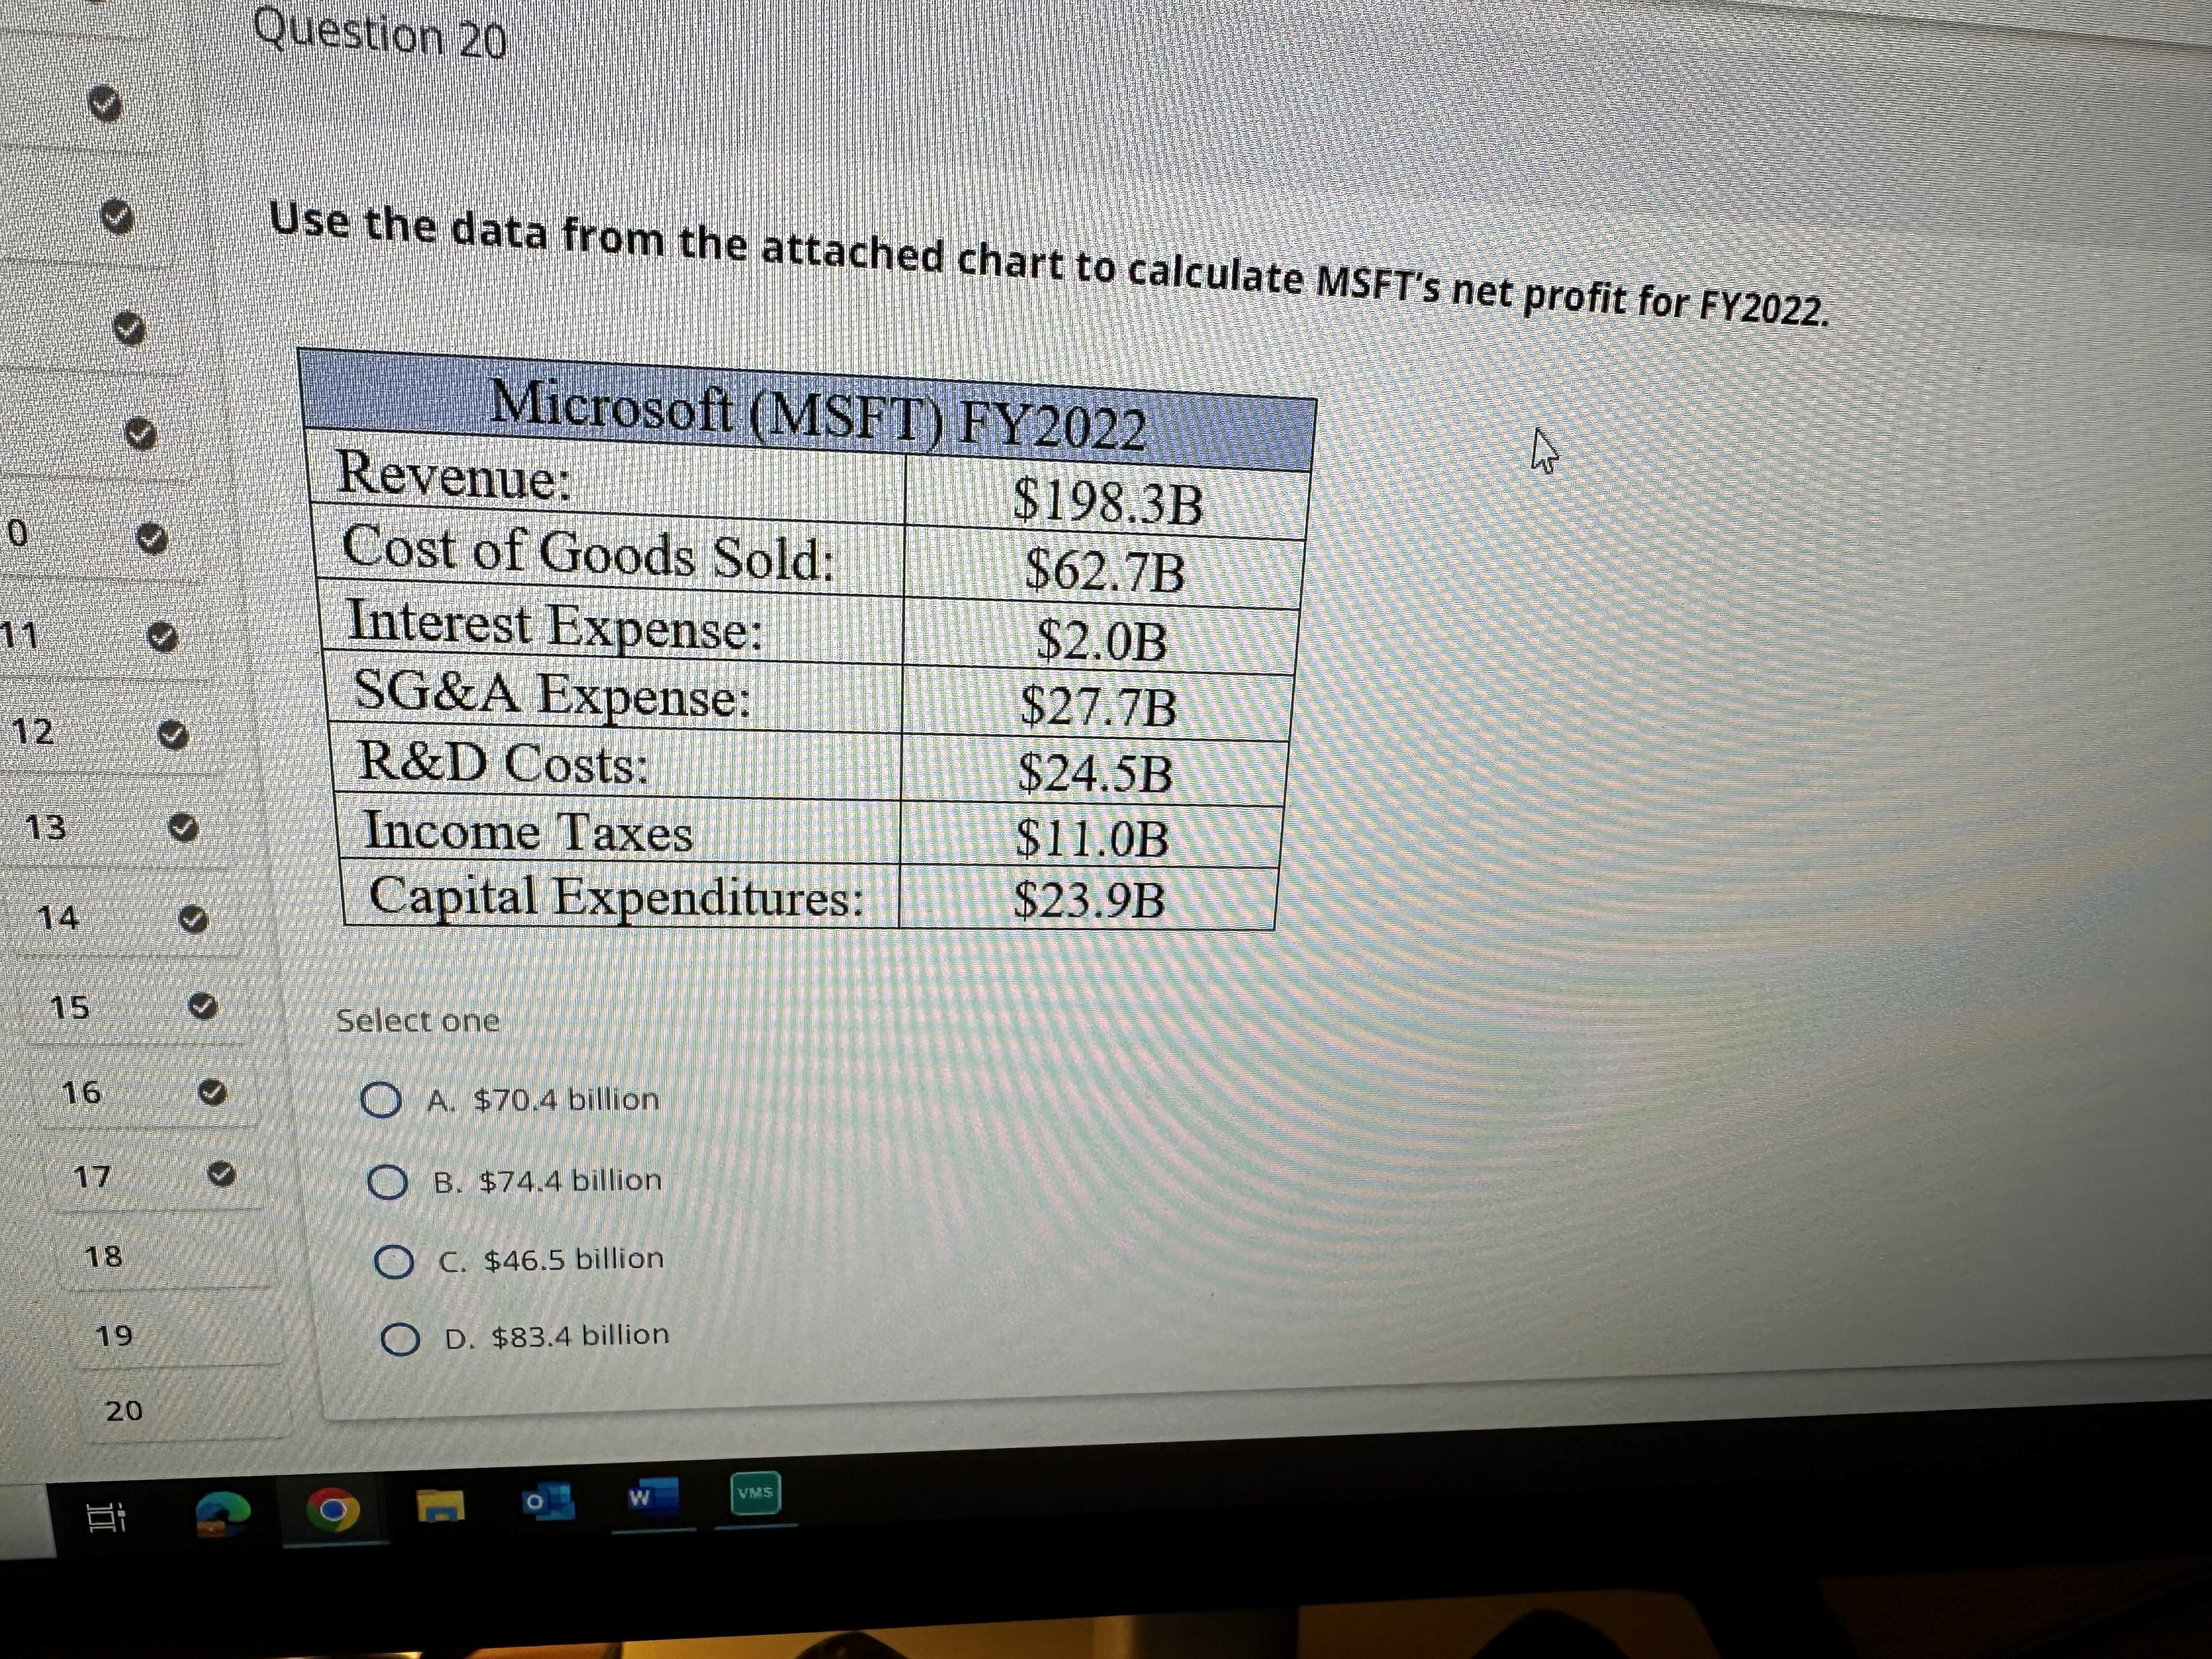
Question 20 Use the data from the attached chart to calculate MSFT's net profit for FY2022. Microsoft (MSFT) FY2022 Revenue: $198.3B Cost of Goods Sold: $62.7B Interest Expense: $2.OB SG&A Expense: 12 $27.7B R&D Costs: $24.5B 13 Income Taxes $11.0B $23.9B 14 Capital Expenditures: 15 Select one 16 O A. $70.4 billion 17 O B. $74.4 billion 18 O C. $46.5 billion 19 D. $83.4 billion 20 W VMS
Step by Step Solution
There are 3 Steps involved in it
1 Expert Approved Answer
Step: 1 Unlock

Question Has Been Solved by an Expert!
Get step-by-step solutions from verified subject matter experts
Step: 2 Unlock
Step: 3 Unlock