

Question: Question 21 (5 points) Continued from Q19~20. The ANOVA results are listed below. What is the p-value for testing equality in mean changes between these

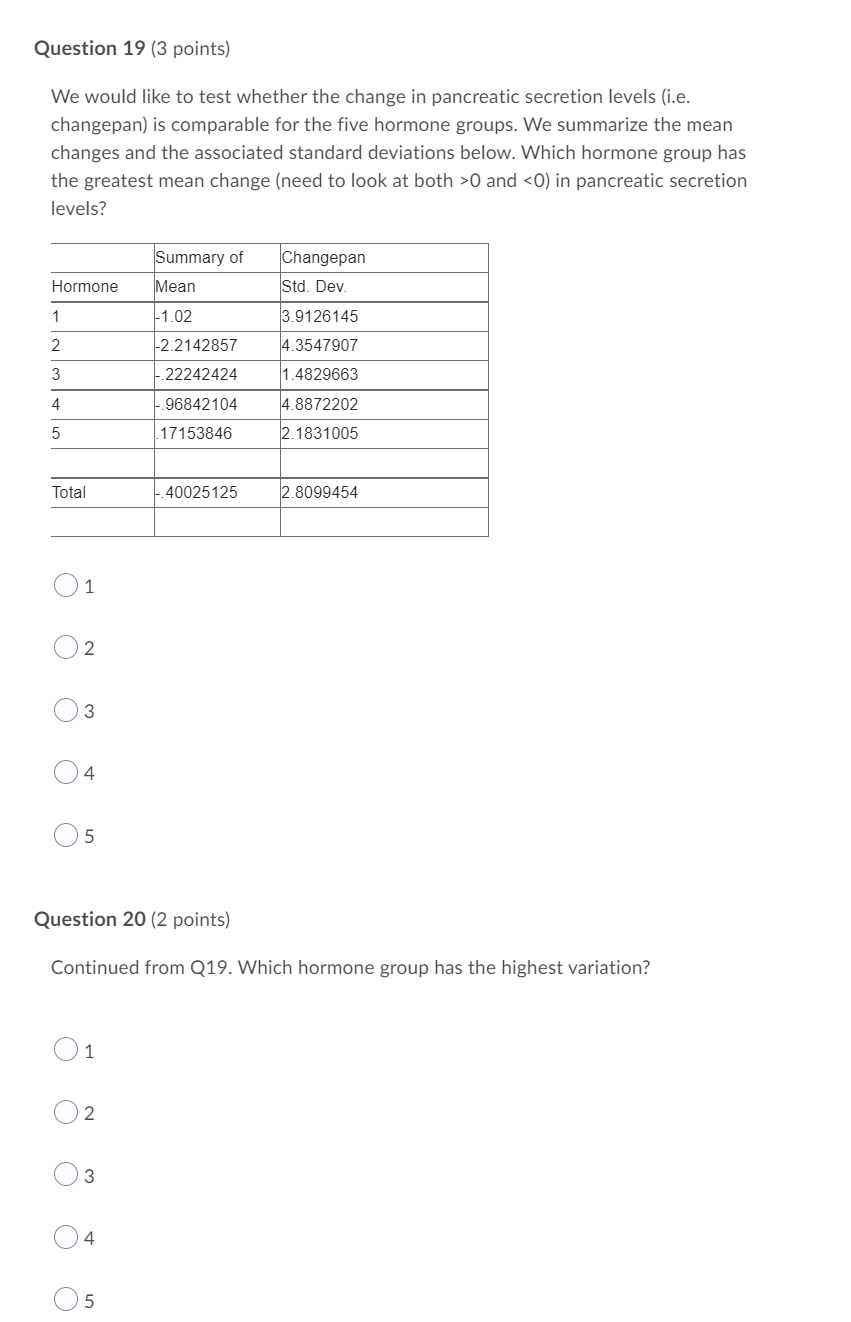
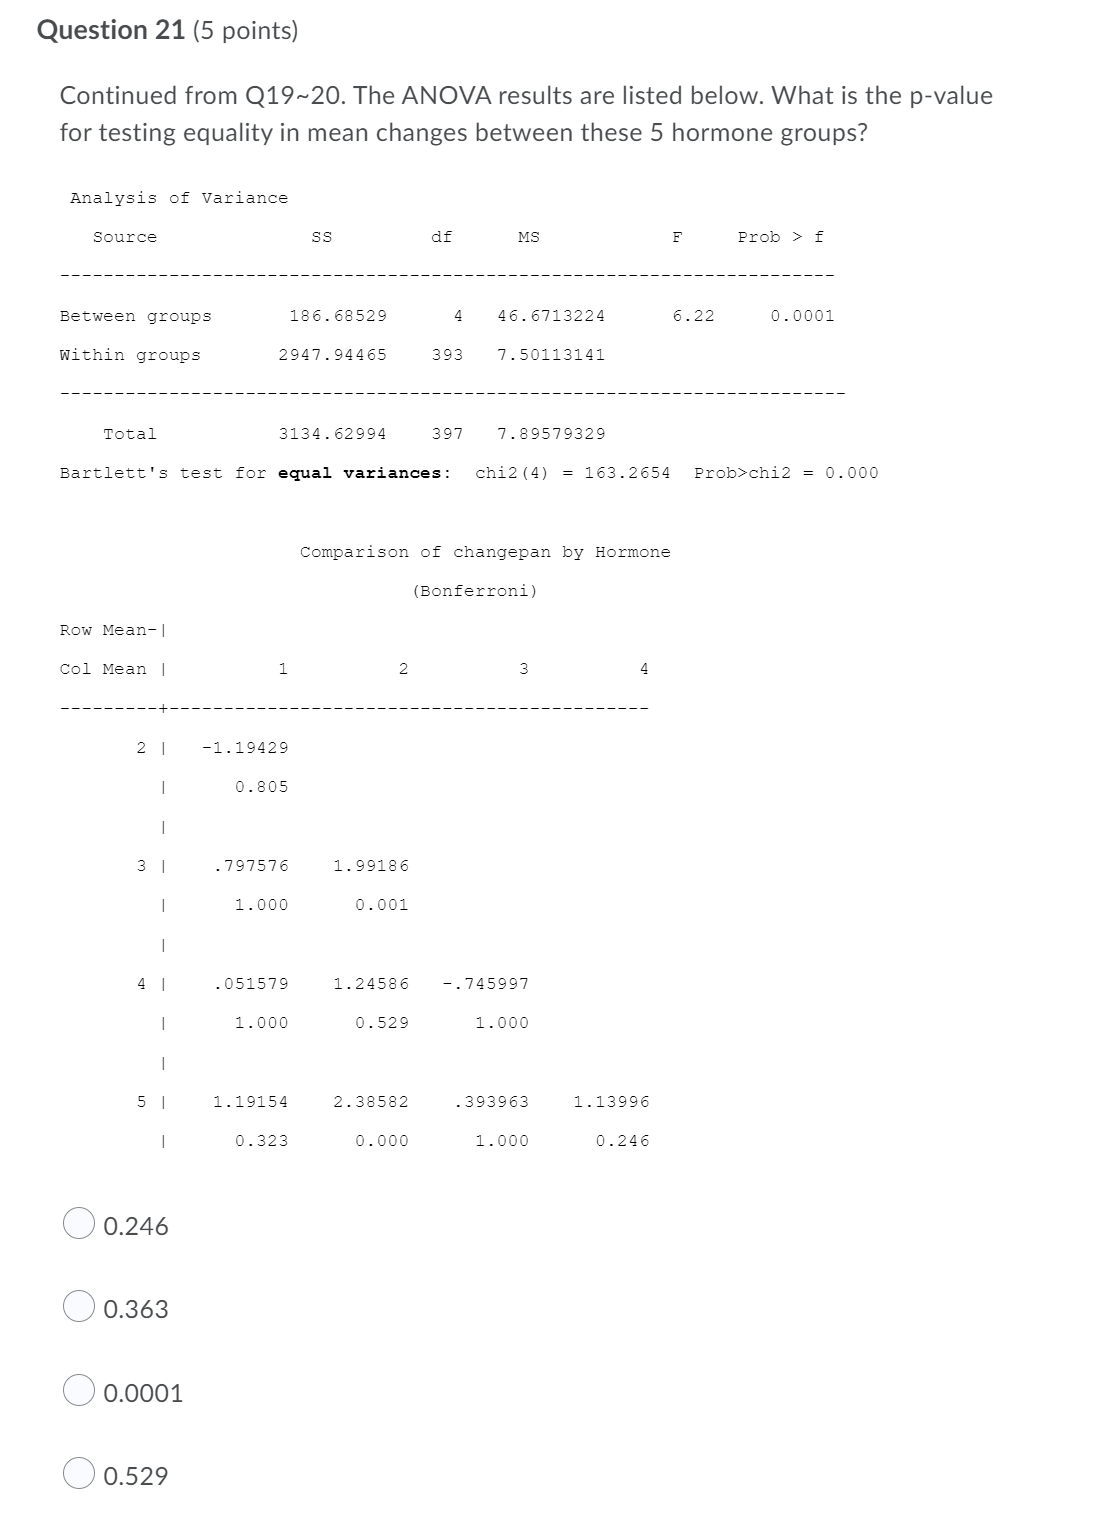

Question 21 (5 points) Continued from Q19~20. The ANOVA results are listed below. What is the p-value for testing equality in mean changes between these 5 hormone groups? Analysis of Variance Source SS df MS F Prob > f Between groups 186. 68529 4 46 . 6713224 6. 22 0 . 0001 Within groups 2947 . 94465 393 7 . 50113141 Total 3134 . 62994 397 7. 89579329 Bartlett's test for equal variances: chi2 (4) = 163.2654 Prob>chi2 = 0.000 Comparison of changepan by Hormone (Bonferroni) Row Mean-I Col Mean | 1 2 3 4 2 1 -1. 19429 0 . 805 3 797576 1. 99186 1 . 000 0 . 001 4 | . 051579 1. 24586 -. 745997 1 . 000 0 . 529 1. 000 5 1 . 19154 2. 38582 . 393963 1. 13996 0 . 323 0 . 000 1. 000 0. 246 O 0.246 O 0.363 0.0001 0.529Question 19 (3 points] We would like to test whether the change in pancreatic secretion levels (i.e. changepan) is comparable for the five hormone groups. We summarize the mean changes and the associated standard deviations below. Which hormone group has the greatest mean change (need to look at both >0 and
Step by Step Solution
There are 3 Steps involved in it

Get step-by-step solutions from verified subject matter experts