

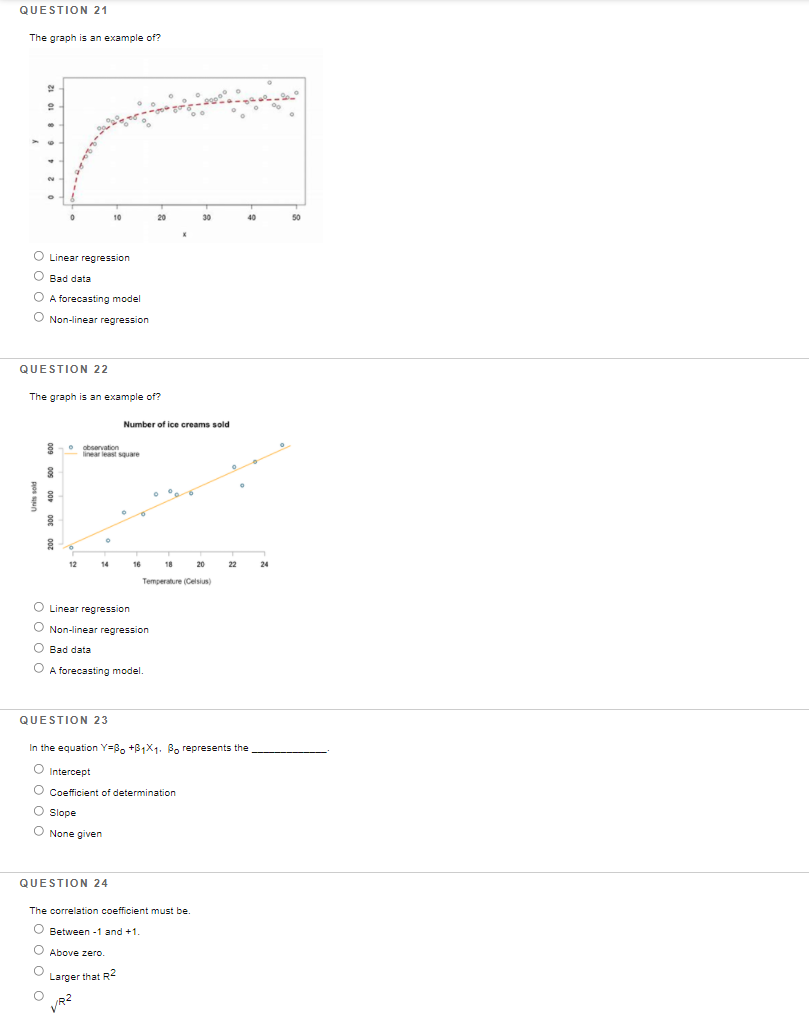
Question: QUESTION 21 The graph is an example of? 10 20 30 40 50 O Linear regression O Bad data O A forecasting model Non-linear regression
Step by Step Solution
There are 3 Steps involved in it
1 Expert Approved Answer
Step: 1 Unlock

Question Has Been Solved by an Expert!
Get step-by-step solutions from verified subject matter experts
Step: 2 Unlock
Step: 3 Unlock