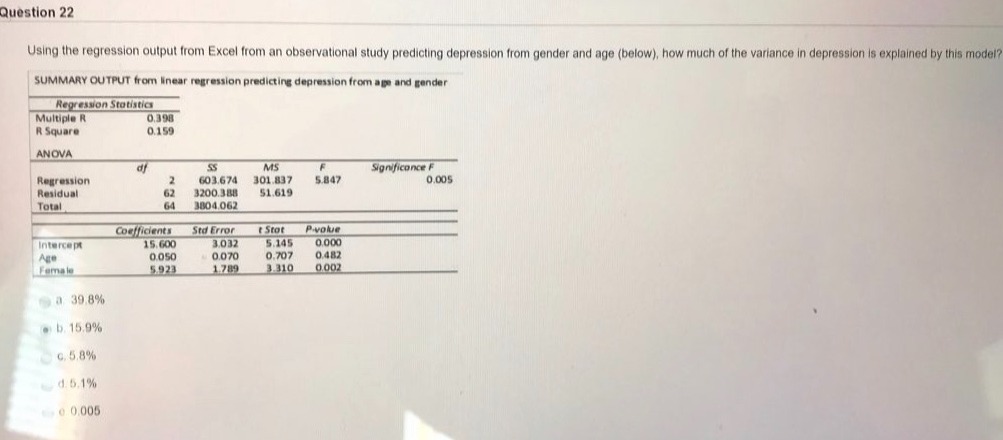
Question: Question 22 Using the regression output from Excel from an observational study predicting depression from gender and age (below), how much of the variance in

Question 22 Using the regression output from
Question 22 Using the regression output from Excel from an observational study predicting depression from gender and age (below), how much of the variance in depression is explained by this model? SUMMARY OUTPUT from linear regression predicting depression from age and gender Regression Statistics Multiple R 0.398 R Square 0.159 ANOVA MS Significance F Regression 603.674 301.837 5.847 0.005 Residual 3200.3 8B 51.619 Total 3804.062 Coefficients Sed Error t Stot P.value Intercept 15.GO0 3.032 5.145 0.000 Age 0.050 0.070 0.707 0.487 Female 5.923 1789 3.310 0.002 a 39.8% b. 15.9% 0. 5.8% d. 5,1% 0 0.005

Step by Step Solution

There are 3 Steps involved in it

1 Expert Approved Answer
Step: 1 Unlock blur-text-image
Question Has Been Solved by an Expert!

Get step-by-step solutions from verified subject matter experts

Step: 2 Unlock
Step: 3 Unlock

Students Have Also Explored These Related Mathematics Questions!