

Question: QUESTION 23 Comparing Pear, Inc. and Grape, Inc. Listed below are comparative balance sheets and income statements with common-size percents for the 2004 and 2003
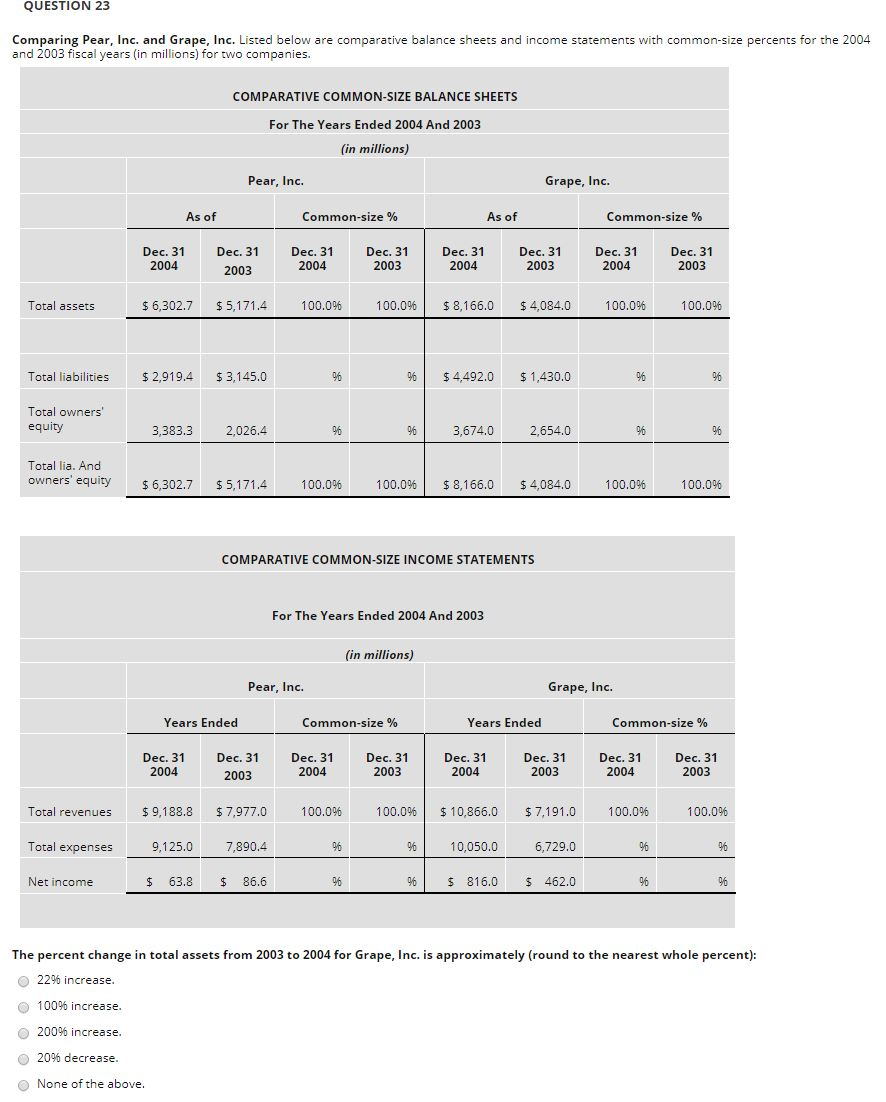
QUESTION 23 Comparing Pear, Inc. and Grape, Inc. Listed below are comparative balance sheets and income statements with common-size percents for the 2004 and 2003 fiscal years (in millions) for two companies. COMPARATIVE COMMON-SIZE BALANCE SHEETS For The Years Ended 2004 And 2003 (in millions) Pear, Inc. Grape, Inc. As of Common-size % As of Common-size % Dec. 31 2004 Dec. 31 2003 Dec. 31 2004 Dec. 31 2003 Dec. 31 2003 Dec. 31 2004 Dec. 31 2003 2004 Total assets $6,302.7 $5,171.4 100.0% 100.0% $ 8,166.0 $4,084.0 100.0% 100.0% Total liabilities $2,919.4 $3,145.0 $ 4,492.0 $1,430.0 Total owners' equity 3,383.3 2,026,4 % % 3,674.0 2,654.0 96 Total lia. And owners' equity $6.302.7 $5.171.4 100.0% 100.0% $ 8.166.0 $4,084.0 100.0% 100.0% COMPARATIVE COMMON-SIZE INCOME STATEMENTS For The Years Ended 2004 And 2003 (in millions) Pear, Inc. Grape, Inc. Years Ended Common-size % Years Ended Common-size % Dec. 31 2004 Dec. 31 2003 Dec. 31 2004 Dec. 31 2003 Dec. 31 2004 Dec. 31 2003 Dec. 31 2004 Dec. 31 2003 Total revenues $ 9,188.8 $ 7,977.0 100.0% 100.096 $ 10,866.0 $7,191.0 100.0% 100.0% Total expenses 9,125.0 7,890.4 10,050.0 6,729.0 Net income $ 63.8 $ 86.6 | $816.0 $ 462.0 The percent change in total assets from 2003 to 2004 for Grape, Inc. is approximately (round to the nearest whole percent): 22% increase 100% increase. 200% increase. 20% decrease. None of the above
Step by Step Solution
There are 3 Steps involved in it

Get step-by-step solutions from verified subject matter experts