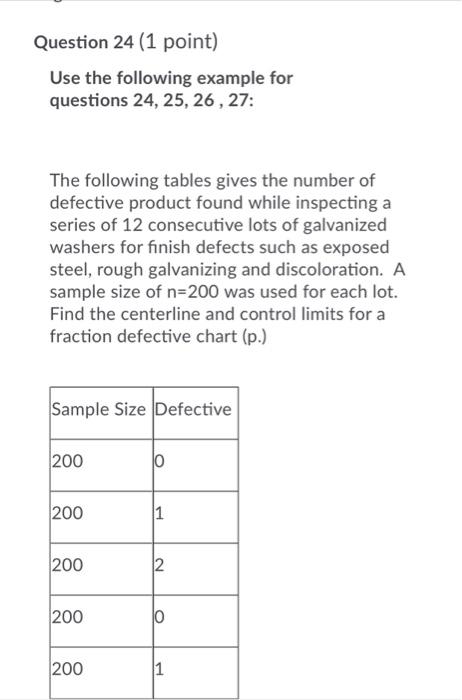
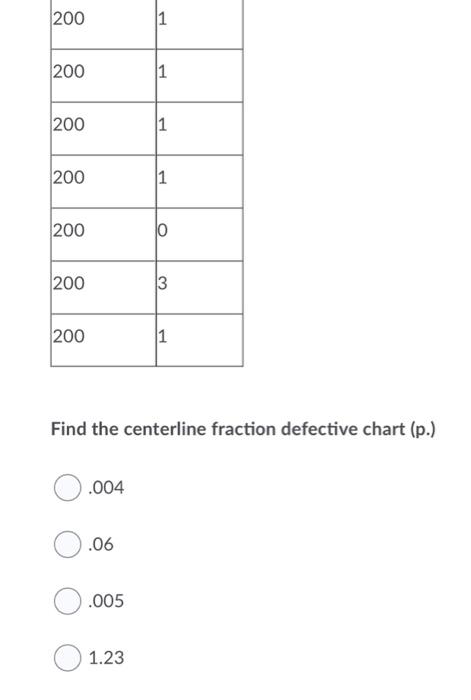
Question: Question 24 (1 point) Use the following example for questions 24, 25, 26, 27: The following tables gives the number of defective product found while

Question 24 (1 point) Use the following example
Question 24 (1 point) Use the following example for questions 24, 25, 26, 27: The following tables gives the number of defective product found while inspecting a series of 12 consecutive lots of galvanized washers for finish defects such as exposed steel, rough galvanizing and discoloration. A sample size of n=200 was used for each lot. Find the centerline and control limits for a fraction defective chart (p.) Sample Size Defective 200 10 200 1 200 2 200 10 200 1 200 1 1 200 1 200 1 1 200 1 200 0 200 3 3 200 1 1 Find the centerline fraction defective chart (p.) .004 .06 .005 1.23

Step by Step Solution

There are 3 Steps involved in it

1 Expert Approved Answer
Step: 1 Unlock blur-text-image
Question Has Been Solved by an Expert!

Get step-by-step solutions from verified subject matter experts

Step: 2 Unlock
Step: 3 Unlock

Students Have Also Explored These Related General Management Questions!