

Question: Question 24 (4 points) The following chart shows the value of a project's CPI over several months. (The x axis is time, measured in months).
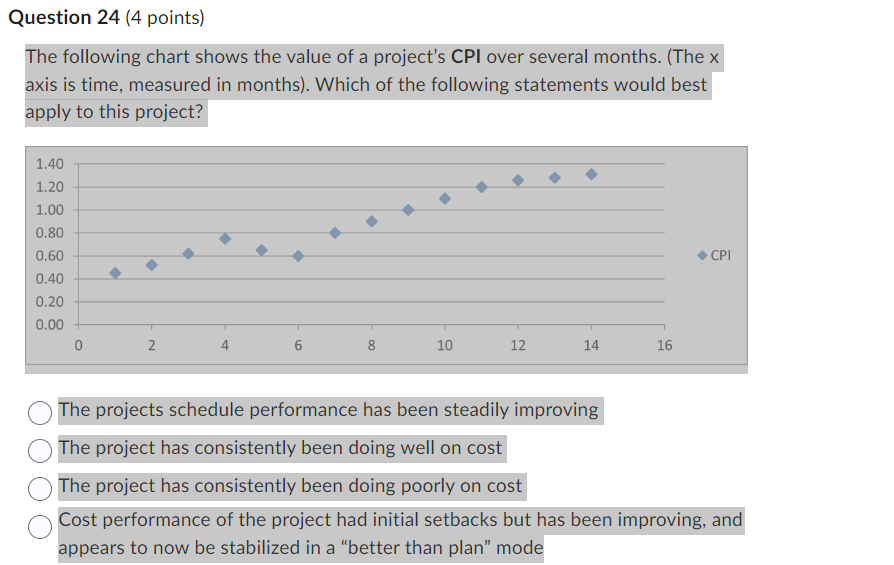
Question 24 (4 points) The following chart shows the value of a project's CPI over several months. (The x axis is time, measured in months). Which of the following statements would best apply to this project? 1.40 1.20 1.00 0.80 0.60 . CPI 0.40 0.20 0.00 0 2 4 6 8 10 12 14 16 The projects schedule performance has been steadily improving O The project has consistently been doing well on cost The project has consistently been doing poorly on cost OC Cost performance of the project had initial setbacks but has been improving, and appears to now be stabilized in a "better than plan" mode
Step by Step Solution
There are 3 Steps involved in it
1 Expert Approved Answer
Step: 1 Unlock

Question Has Been Solved by an Expert!
Get step-by-step solutions from verified subject matter experts
Step: 2 Unlock
Step: 3 Unlock