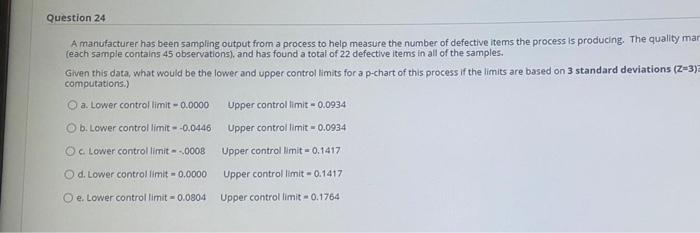
Question: Question 24 A manufacturer has been sampling output from a process to help measure the number of defective items the process is producing. The quality

Question 24 A manufacturer has been sampling
Question 24 A manufacturer has been sampling output from a process to help measure the number of defective items the process is producing. The quality mar (each sample contains 45 observations), and has found a total of 22 defective items in all of the samples. Given this data, what would be the lower and upper control limits for a p-chart of this process if the limits are based on 3 standard deviations (z=3) computations.) a. Lower controllimit -0.0000 Upper controllimit -0.0934 O b. Lower controllimit - -0.0446 Upper controllimit -0.0934 c Lower controllimit - 0008 Upper controllimit -0.1417 O d. Lower controllimit = 0.0000 Upper controllimit -0.1417 O e. Lower controllimit -0.0804 Upper controllimit -0.1764

Step by Step Solution

There are 3 Steps involved in it

1 Expert Approved Answer
Step: 1 Unlock blur-text-image
Question Has Been Solved by an Expert!

Get step-by-step solutions from verified subject matter experts

Step: 2 Unlock
Step: 3 Unlock

Students Have Also Explored These Related General Management Questions!