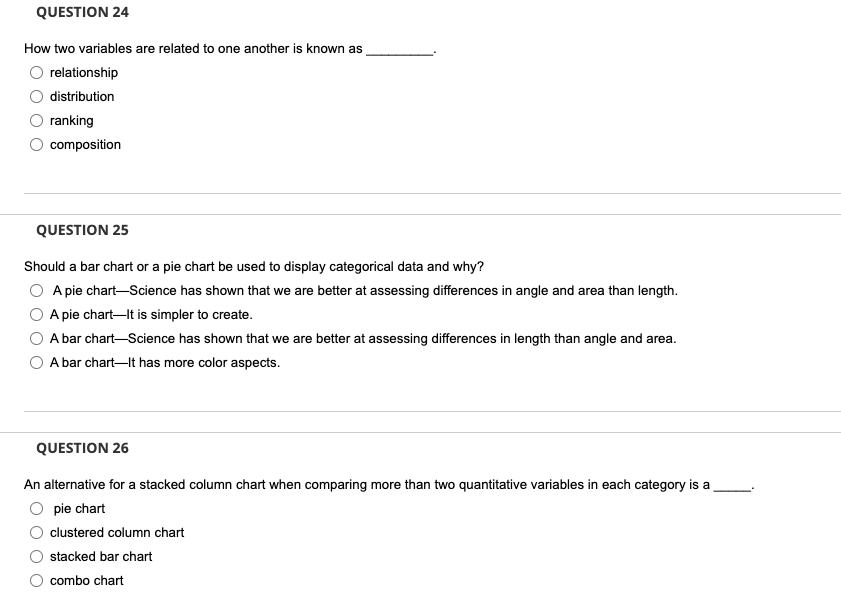
Question: QUESTION 24 How two variables are related to one another is known as relationship distribution ranking composition QUESTION 25 Should a bar chart or a

QUESTION 24 How two variables are related to one

QUESTION 24 How two variables are related to one another is known as relationship distribution ranking composition QUESTION 25 Should a bar chart or a pie chart be used to display categorical data and why? A pie chartScience has shown that we are better at assessing differences in angle and area than length. A pie chartit is simpler to create. A bar chartScience has shown that we are better at assessing differences in length than angle and area. A bar chartit has more color aspects. QUESTION 26 An alternative for a stacked column chart when comparing more than two quantitative variables in each category is a pie chart clustered column chart stacked bar chart combo chart

Step by Step Solution

There are 3 Steps involved in it

1 Expert Approved Answer
Step: 1 Unlock blur-text-image
Question Has Been Solved by an Expert!

Get step-by-step solutions from verified subject matter experts

Step: 2 Unlock
Step: 3 Unlock

Students Have Also Explored These Related General Management Questions!