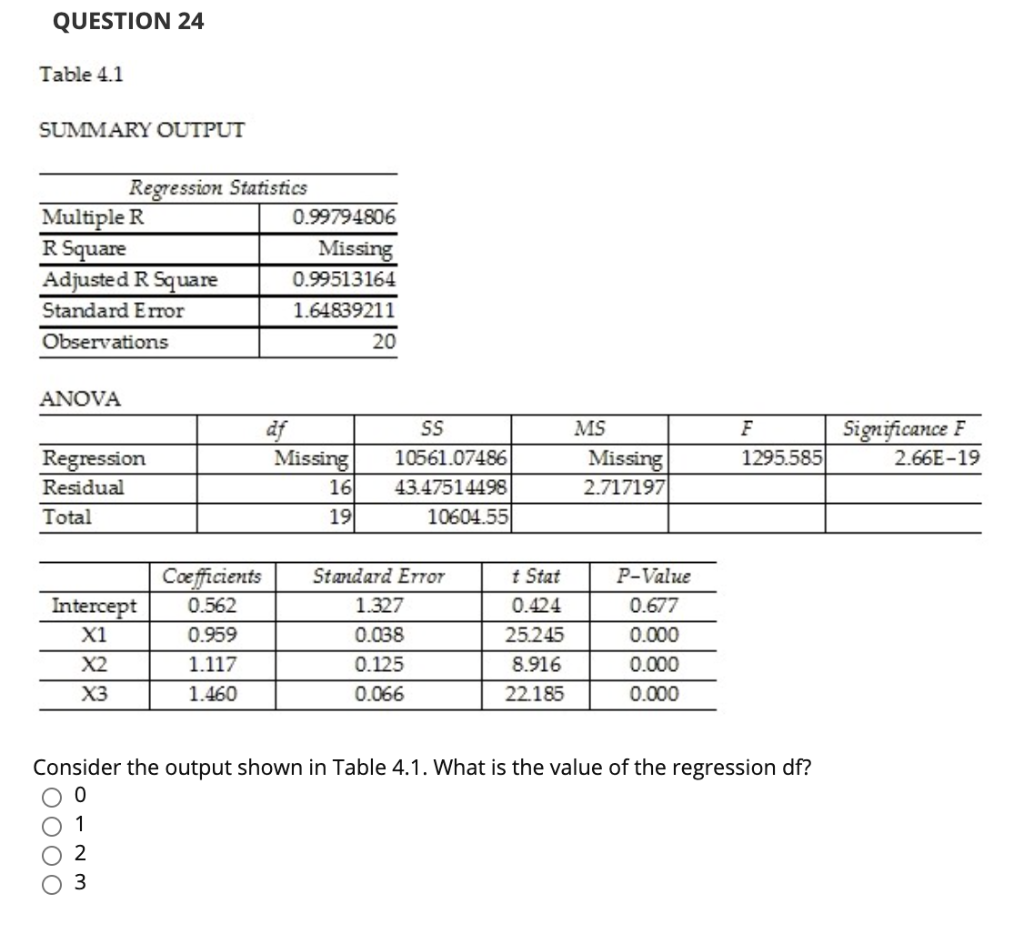
Question: QUESTION 24 Table 4.1 SUMMARY OUTPUT Regression Statistics Multiple R 0.99794806 Missing Adjusted R Square 0.99513164 Standard Error 1.64839211 Observations 20 R Square ANOVA Significance

QUESTION 24 Table 4.1 SUMMARY OUTPUT Regression

QUESTION 24 Table 4.1 SUMMARY OUTPUT Regression Statistics Multiple R 0.99794806 Missing Adjusted R Square 0.99513164 Standard Error 1.64839211 Observations 20 R Square ANOVA Significance F 2.66E-19 Regression Residual Total 1295.585 df Missing) 161 19. MS Missing 2.717197 SS 10561.07486 43.47514498 10604.551 Intercept X1 X2 Coefficients 0.562 0.959 1.117 1.460 Standard Error 1.327 0.038 0.125 0.066 t Stat 0.424 25.245 8.916 22.185 P-Value 0.677 0.000 0.000 0.000 X3 Consider the output shown in Table 4.1. What is the value of the regression df? 0

Step by Step Solution

There are 3 Steps involved in it

1 Expert Approved Answer
Step: 1 Unlock blur-text-image
Question Has Been Solved by an Expert!

Get step-by-step solutions from verified subject matter experts

Step: 2 Unlock
Step: 3 Unlock

Students Have Also Explored These Related General Management Questions!