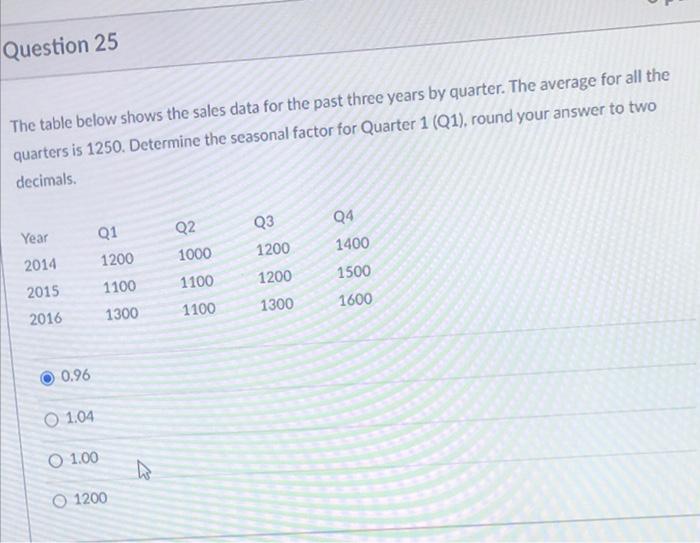
Question: Question 25 The table below shows the sales data for the past three years by quarter. The average for all the quarters is 1250. Determine

Question 25 The table below shows the sales data
Question 25 The table below shows the sales data for the past three years by quarter. The average for all the quarters is 1250. Determine the seasonal factor for Quarter 1 (Q1), round your answer to two decimals. Q3 Year Q1 1200 Q2 1000 1200 2014 Q4 1400 1500 1600 1200 1100 2015 1100 1300 1100 2016 1300 0.96 O 1.04 O 1.00 O 1200

Step by Step Solution

There are 3 Steps involved in it

1 Expert Approved Answer
Step: 1 Unlock blur-text-image
Question Has Been Solved by an Expert!

Get step-by-step solutions from verified subject matter experts

Step: 2 Unlock
Step: 3 Unlock

Students Have Also Explored These Related General Management Questions!