

Question: Question 26 (12.7 points) The graph represents how the depth of water D (in meters) at the end of a dock varies with the
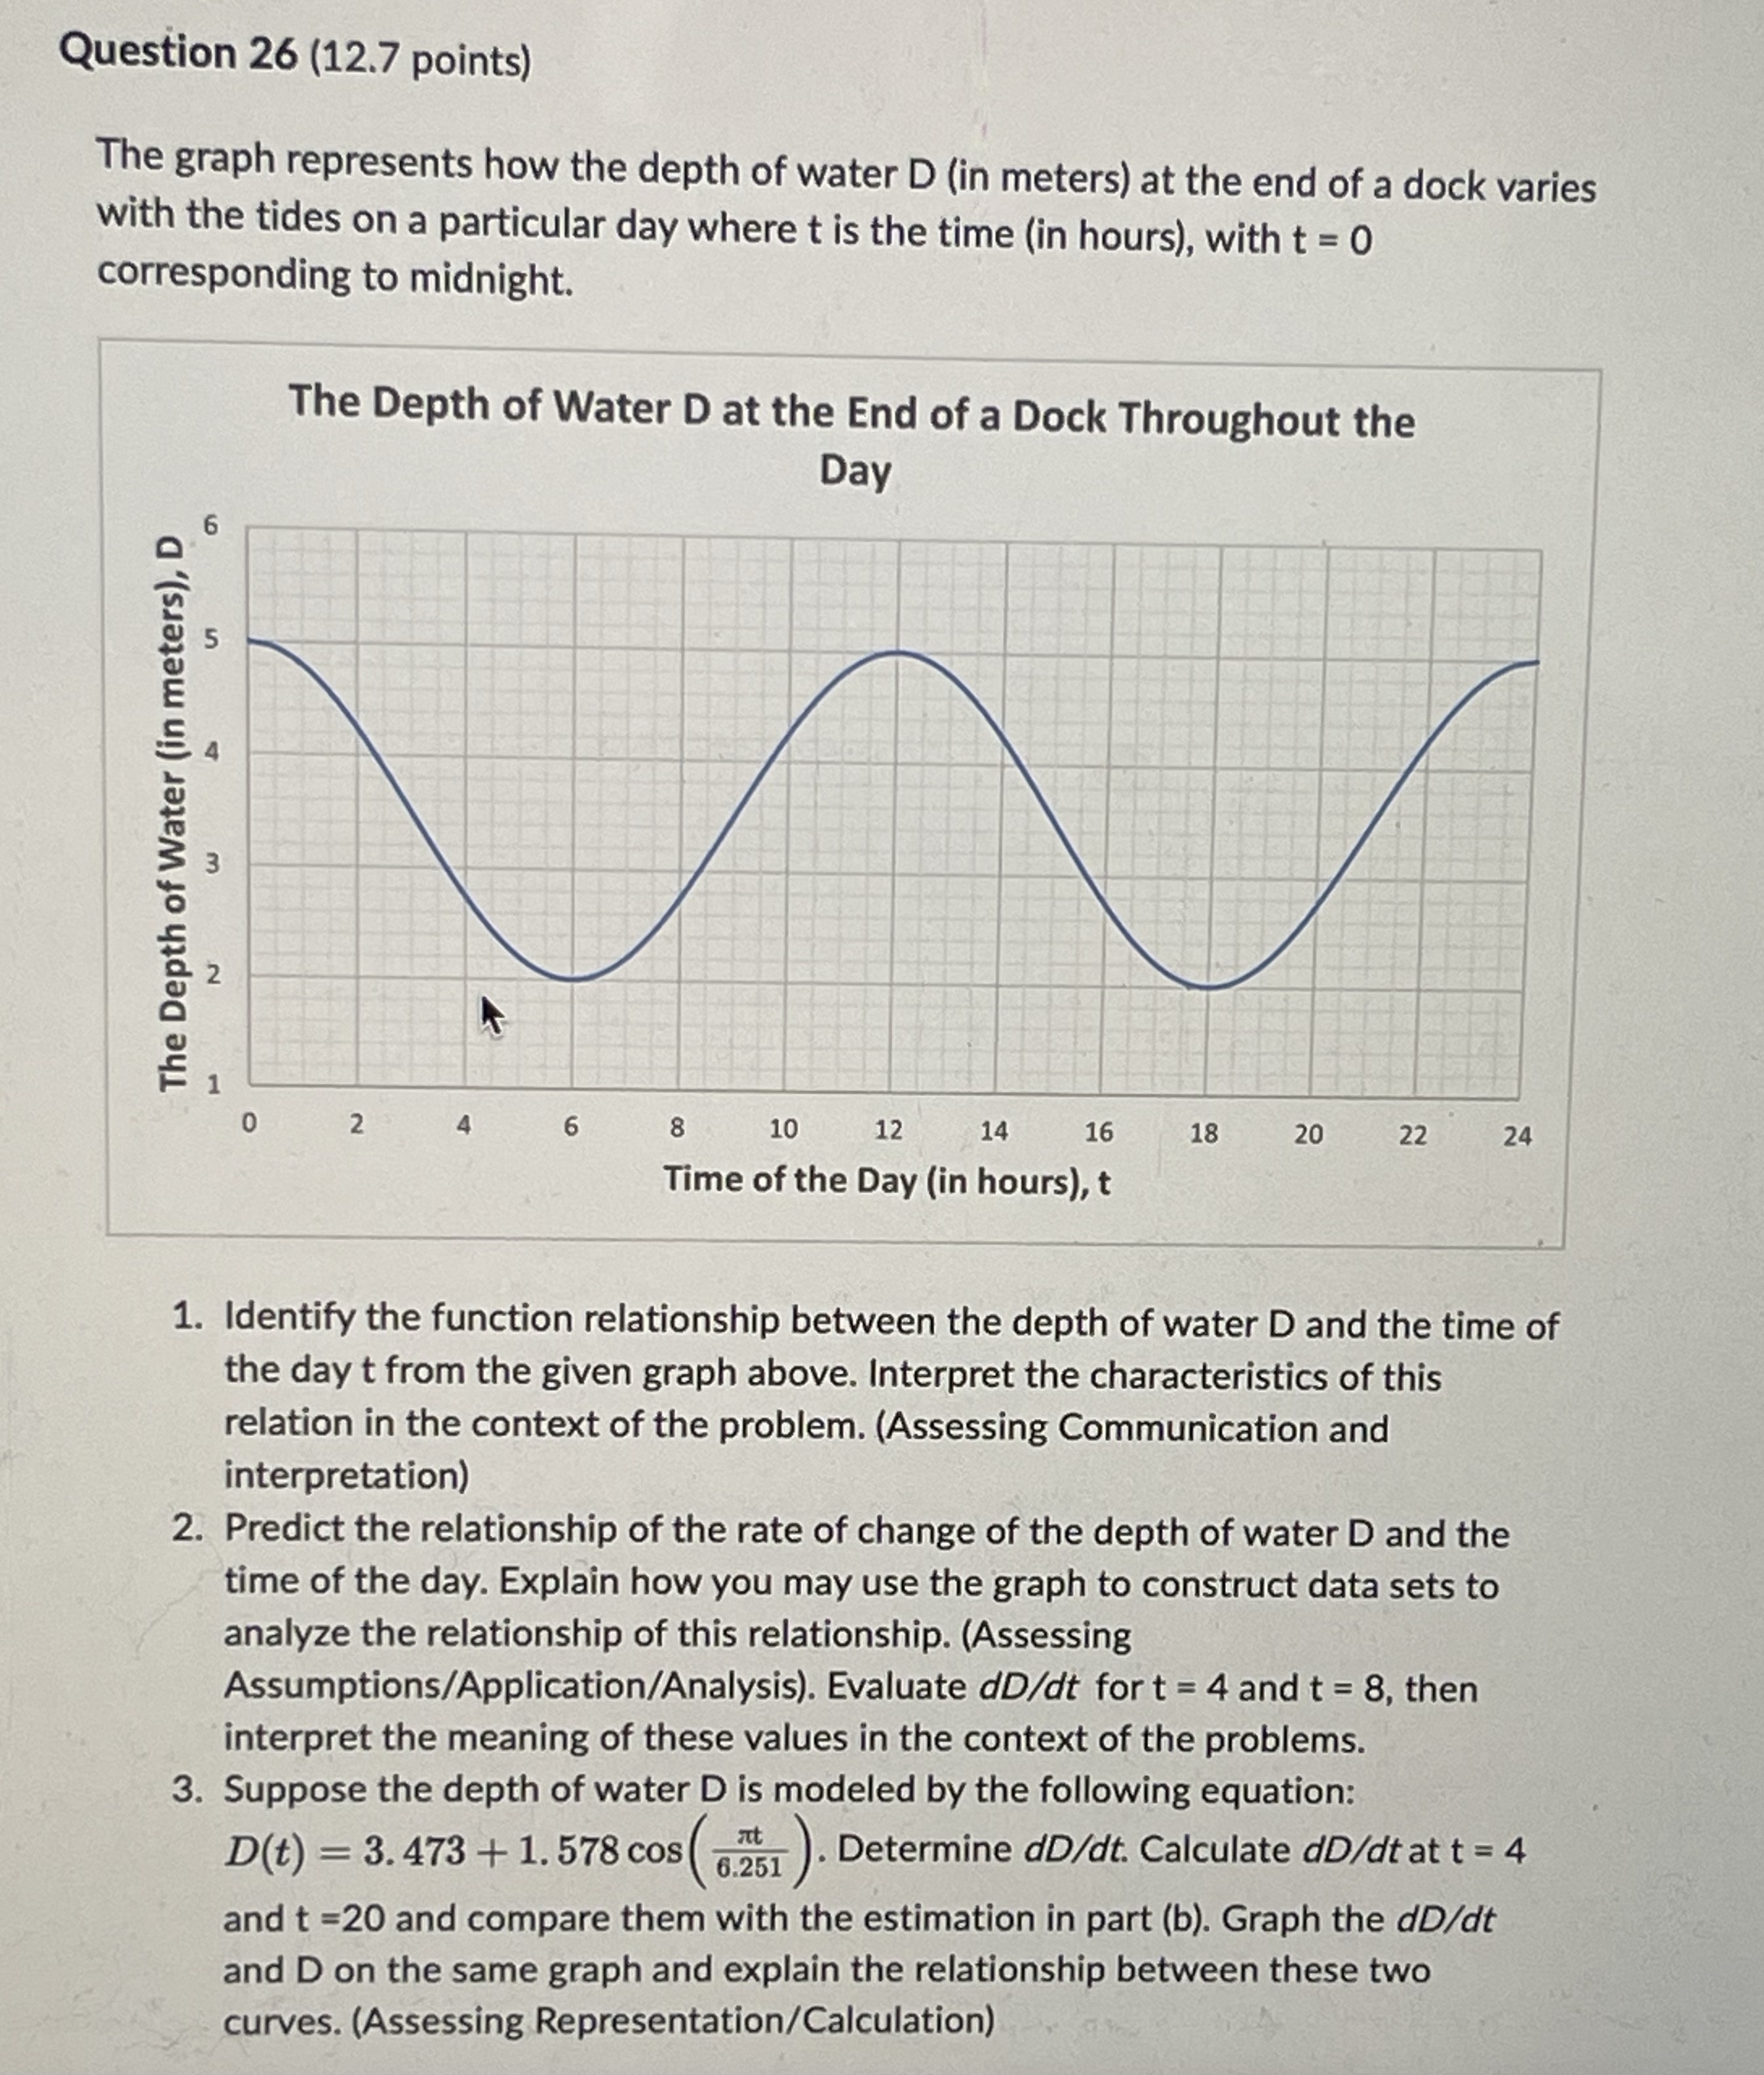
Question 26 (12.7 points) The graph represents how the depth of water D (in meters) at the end of a dock varies with the tides on a particular day where t is the time (in hours), with t = 0 corresponding to midnight. The Depth of Water D at the End of a Dock Throughout the Day 6 The Depth of Water (in meters), D 1 2 3 S 0 2 4 6 8 10 12 14 16 18 20 Time of the Day (in hours), t 22 22 24 1. Identify the function relationship between the depth of water D and the time of the day t from the given graph above. Interpret the characteristics of this relation in the context of the problem. (Assessing Communication and interpretation) 2. Predict the relationship of the rate of change of the depth of water D and the time of the day. Explain how you may use the graph to construct data sets to analyze the relationship of this relationship. (Assessing Assumptions/Application/Analysis). Evaluate dD/dt for t = 4 and t = 8, then interpret the meaning of these values in the context of the problems. 3. Suppose the depth of water D is modeled by the following equation: D(t)=3.473+1.578 cos Os (6.251). Determine dD/dt. Calculate dD/dt at t = 4 and t =20 and compare them with the estimation in part (b). Graph the dD/dt and D on the same graph and explain the relationship between these two curves. (Assessing Representation/Calculation)
Step by Step Solution
There are 3 Steps involved in it

Get step-by-step solutions from verified subject matter experts