

Question: Question 26: A Professor gets a bit suspicious about the results of the test because it was stronger than what Based on the she expected.
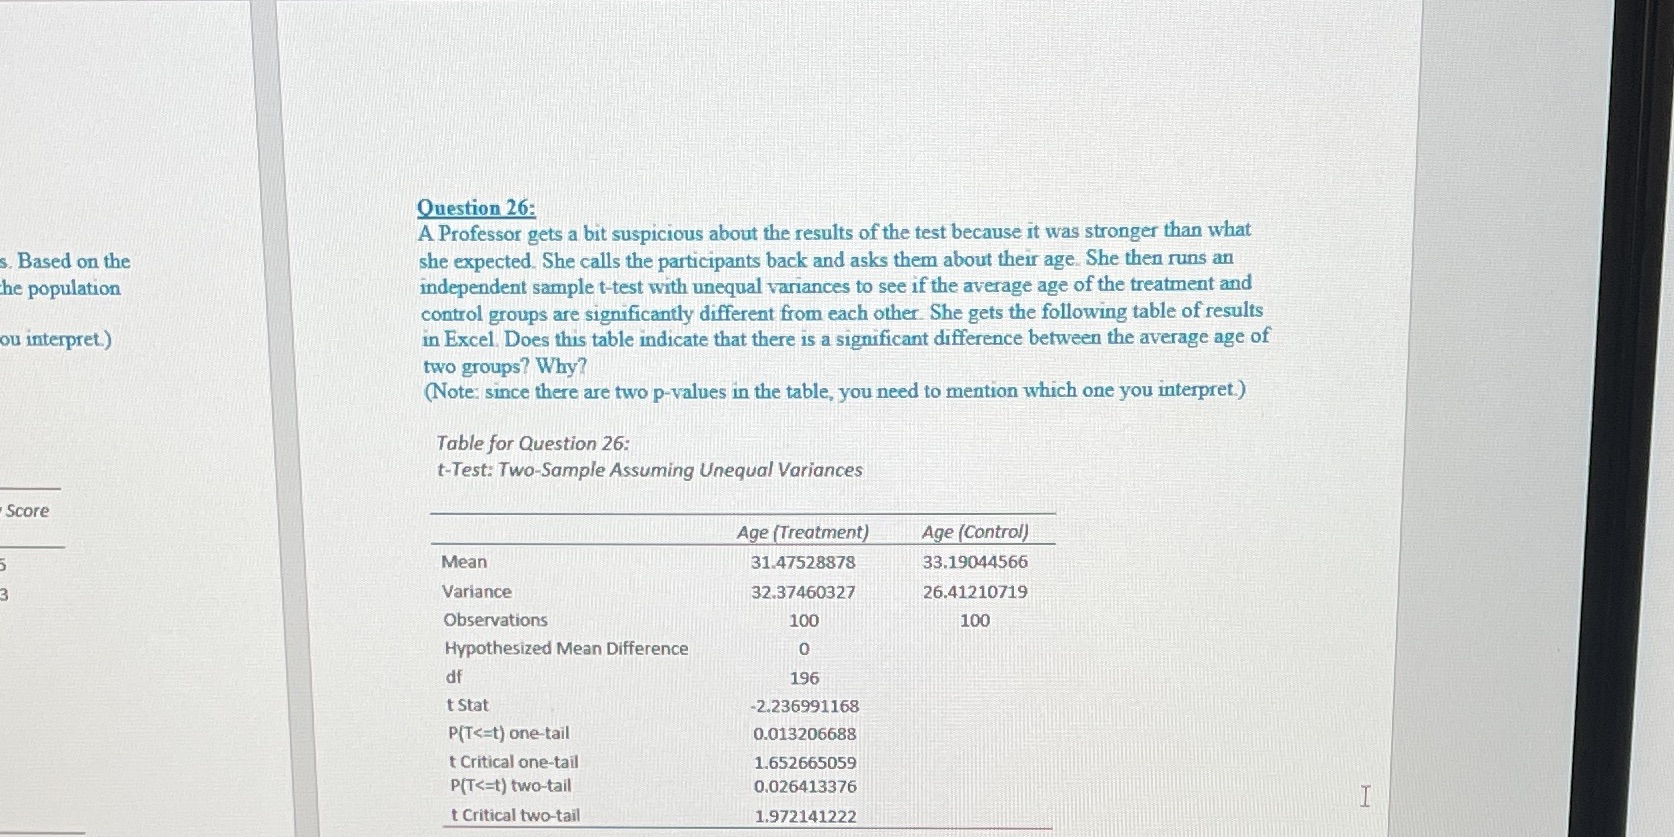
Question 26: A Professor gets a bit suspicious about the results of the test because it was stronger than what Based on the she expected. She calls the participants back and asks them about their age. She then runs an the population independent sample t-test with unequal variances to see if the average age of the treatment and control groups are significantly different from each other. She gets the following table of results ou interpret) in Excel. Does this table indicate that there is a significant difference between the average age of two groups? Why? (Note: since there are two p-values in the table, you need to mention which one you interpret.) Table for Question 26: t-Test: Two-Sample Assuming Unequal Variances Score Age (Treatment) Age (Control) Mean 31.47528878 33.19044566 Variance 32.37460327 26.41210719 Observations 100 100 Hypothesized Mean Difference 0 df 196 t Stat 2.236991168 P(T
Step by Step Solution
There are 3 Steps involved in it

Get step-by-step solutions from verified subject matter experts