

Question: QUESTION 26 You created a controlled comparison table displaying individuals' opinion on Prop 1 across different levels of indiv Partisanship Republican Democrat Annual income Annual
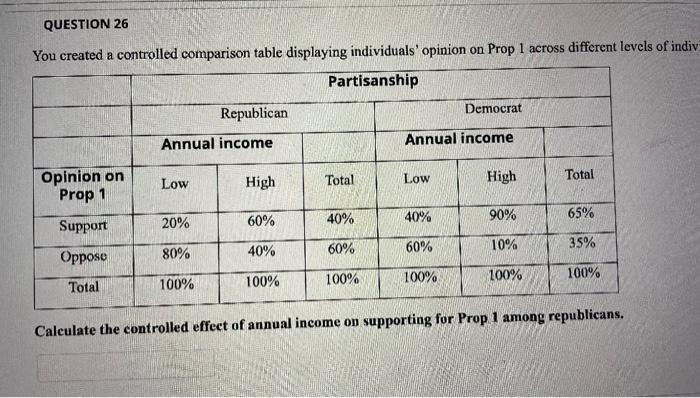
QUESTION 26 You created a controlled comparison table displaying individuals' opinion on Prop 1 across different levels of indiv Partisanship Republican Democrat Annual income Annual income Low Total Opinion on Prop 1 High Low Total High 40% 20% 60% 40% 90% 65% Support 40% 60% 80% 60% 10% 35% Oppose Total 100% 100% 100% 100% 100% 100% Calculate the controlled effect of annual income on supporting for Prop 1 among republicans
Step by Step Solution
There are 3 Steps involved in it
1 Expert Approved Answer
Step: 1 Unlock

Question Has Been Solved by an Expert!
Get step-by-step solutions from verified subject matter experts
Step: 2 Unlock
Step: 3 Unlock