

Question: Question 27 (4 points) The figures below represent costs attributable to expert services advice when applying the standards and the process of certification of a
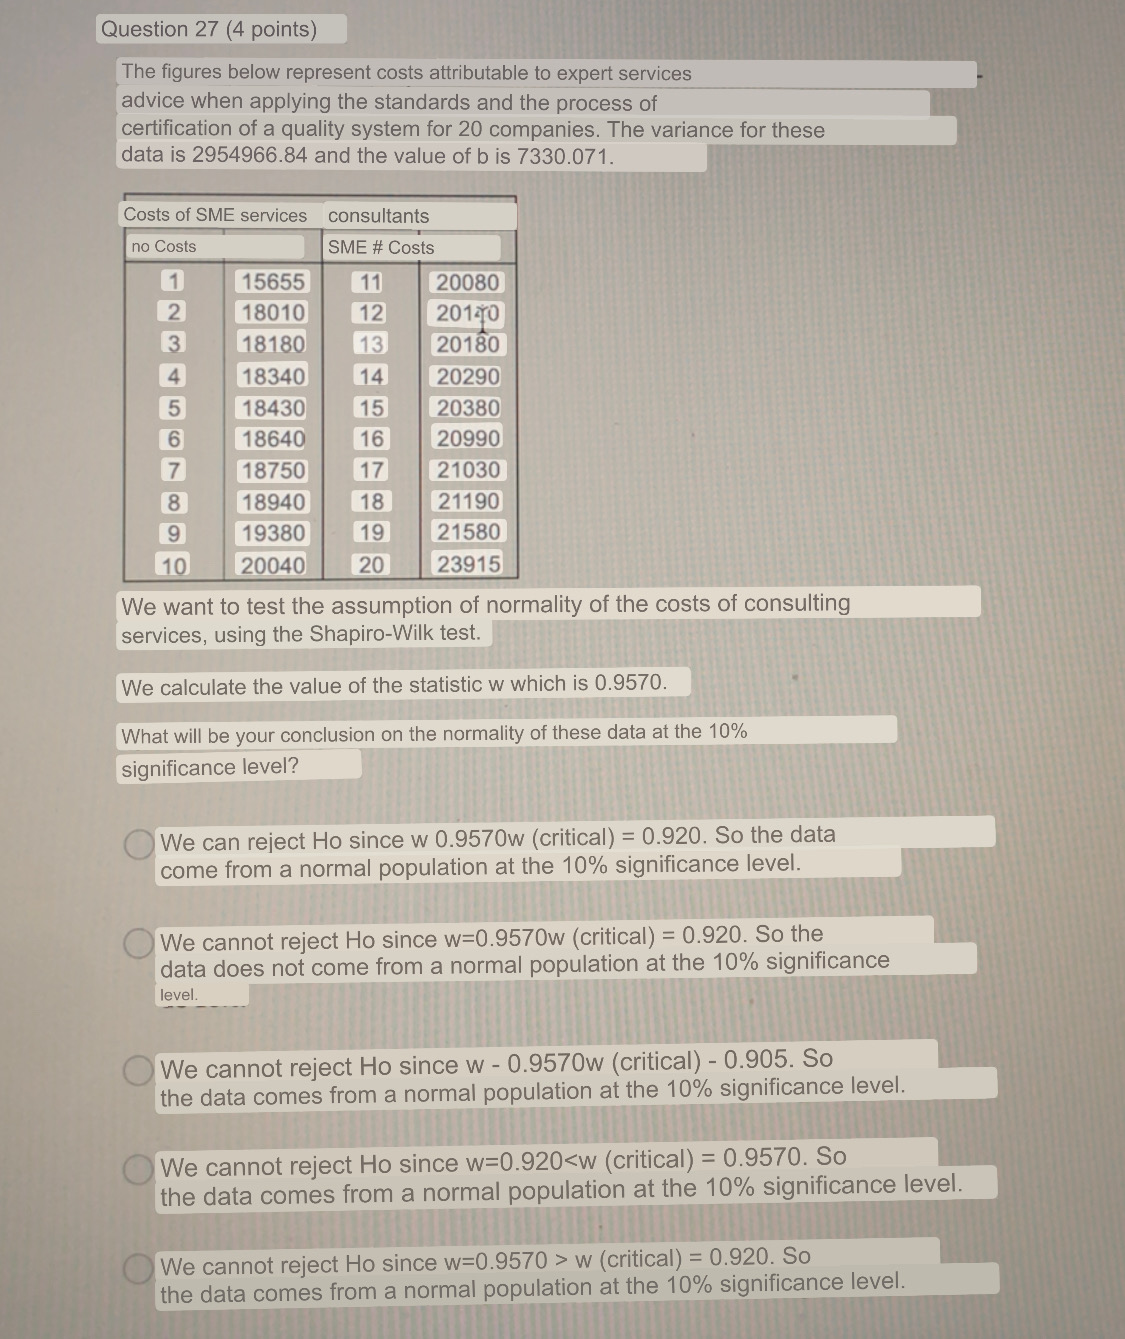
Question 27 (4 points) The figures below represent costs attributable to expert services advice when applying the standards and the process of certification of a quality system for 20 companies. The variance for these data is 2954966.84 and the value of b is 7330.071. Costs of SME services consultants no Costs SME # Costs 15655 11 20080 IN 18010 12 2010 3 18180 13 20180 4 18340 14 20290 5 18430 15 20380 6 18640 16 20990 7 18750 17 21030 8 18940 18 21190 19380 19 21580 10 20040 20 23915 We want to test the assumption of normality of the costs of consulting services, using the Shapiro-Wilk test. We calculate the value of the statistic w which is 0.9570. What will be your conclusion on the normality of these data at the 10% significance level? We can reject Ho since w 0.9570w (critical) = 0.920. So the data come from a normal population at the 10% significance level We cannot reject Ho since w=0.9570w (critical) = 0.920. So the data does not come from a normal population at the 10% significance level . We cannot reject Ho since w - 0.9570w (critical) - 0.905. So the data comes from a normal population at the 10% significance level. We cannot reject Ho since w=0.920
Step by Step Solution
There are 3 Steps involved in it

Get step-by-step solutions from verified subject matter experts