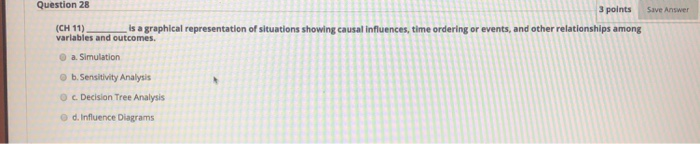
Question: Question 28 Save Answer 3 points is a graphical representation of situations showing causal influences, time ordering or events, and other relationships among (CH 11)

Question 28 Save Answer 3 points is a graphical
Question 28 Save Answer 3 points is a graphical representation of situations showing causal influences, time ordering or events, and other relationships among (CH 11) variables and outcomes. a. Simulation b. Sensitivity Analysis c. Decision Tree Analysis d. Influence Diagrams Question 29 3 points Suve Answer (CH 11) You are managing a project to set up data servers to support a website for an enterprise customer. The location of the servers has been chosen to be close to the customer due to their requirements. However, this location is prone to natural disasters, such as hurricanes and flooding. You have decided to install some extra servers in another city that will act as backup If a disaster happens. This is an example of which of the following? a. Risk avoidance b. Risk mitigation c. Risk acceptance d. Risk transfer

Step by Step Solution

There are 3 Steps involved in it

1 Expert Approved Answer
Step: 1 Unlock blur-text-image
Question Has Been Solved by an Expert!

Get step-by-step solutions from verified subject matter experts

Step: 2 Unlock
Step: 3 Unlock

Students Have Also Explored These Related General Management Questions!